SPY Financial Telemetry - May 8, 2026
Market-implied expectations derived from options market structure.
VYREON LABS
Published May 10, 2026
This report is generated from the output of a proprietary quantitative system that measures market structure, conditions, and forward expectations, translating system measurements into descriptive statements about the market environment.
Market Snapshot
Regime: Expanding, unstable repricing
Near-Term (~2 to 4 weeks): Reactive, strengthening behavior
Short-Term (~1 to 2 months): Weakening, fragmented structure
Medium-Term (~2 to 4 months): Transitional, deteriorating structure
Long-Term (~6 to 12 months): Stable, softening anchor
Structure: Conflicted across maturities
Market State
Expanding volatility conditions remain associated with unstable repricing behavior, where realized movement is diverging from prior expectation structure and reducing clean continuation reliability.
Near-term expectations are strengthening through faster local repricing, though short-horizon movement remains sensitive to fragmented positioning across nearby expiries.
Short-term structure is weakening with wide uncertainty, reflecting deteriorating continuation quality and increased reversal sensitivity across the one-to-two-month window.
Medium-term structure continues weakening through smoother structural adjustment, suggesting broader deterioration rather than isolated near-term instability.
Long-term structure remains comparatively stable, though its positive anchor is not strengthening enough to confirm broad directional alignment.
Cross-horizon structure remains conflicted, with no complete directional alignment across horizons.
Different maturity windows are repricing at different speeds, reflecting uneven adjustment within the same evolving market structure.
Market Insights
Price behavior is increasingly characterized by unstable traversal rather than orderly continuation, constraining trend-dependent holding periods as repricing becomes fragmented across maturities.
Short-horizon movement remains reactive and timing-sensitive, reducing execution consistency for fast directional structures as nearby expiry positioning continues to reshape local movement conditions.
Medium-duration deterioration reduces continuation reliability, making longer holding-period structures more vulnerable to failed follow-through as expectation geometry weakens across the central maturity window.
Variability-driven outcomes currently dominate directional reliability, reducing confidence in broad directional positioning as innovation dispersion reflects unstable structural adjustment.
Cross-horizon disagreement weakens signal consistency, disadvantaging positioning dependent on synchronized participation as different maturities reprice at different speeds.
What Changed This Week
Near-term structure strengthened while uncertainty narrowed, reflecting improved short-horizon responsiveness and tighter local repricing dispersion.
Short-term structure weakened materially while uncertainty widened, reflecting increasing fragmentation and deteriorating continuation quality across the one-to-two-month window.
Medium-term structure also weakened while uncertainty expanded, reinforcing broader deterioration across the central structural horizon.
Long-term structure softened slightly while uncertainty widened modestly, indicating gradual re-anchoring rather than decisive long-duration directional deterioration.
Volatility Regime
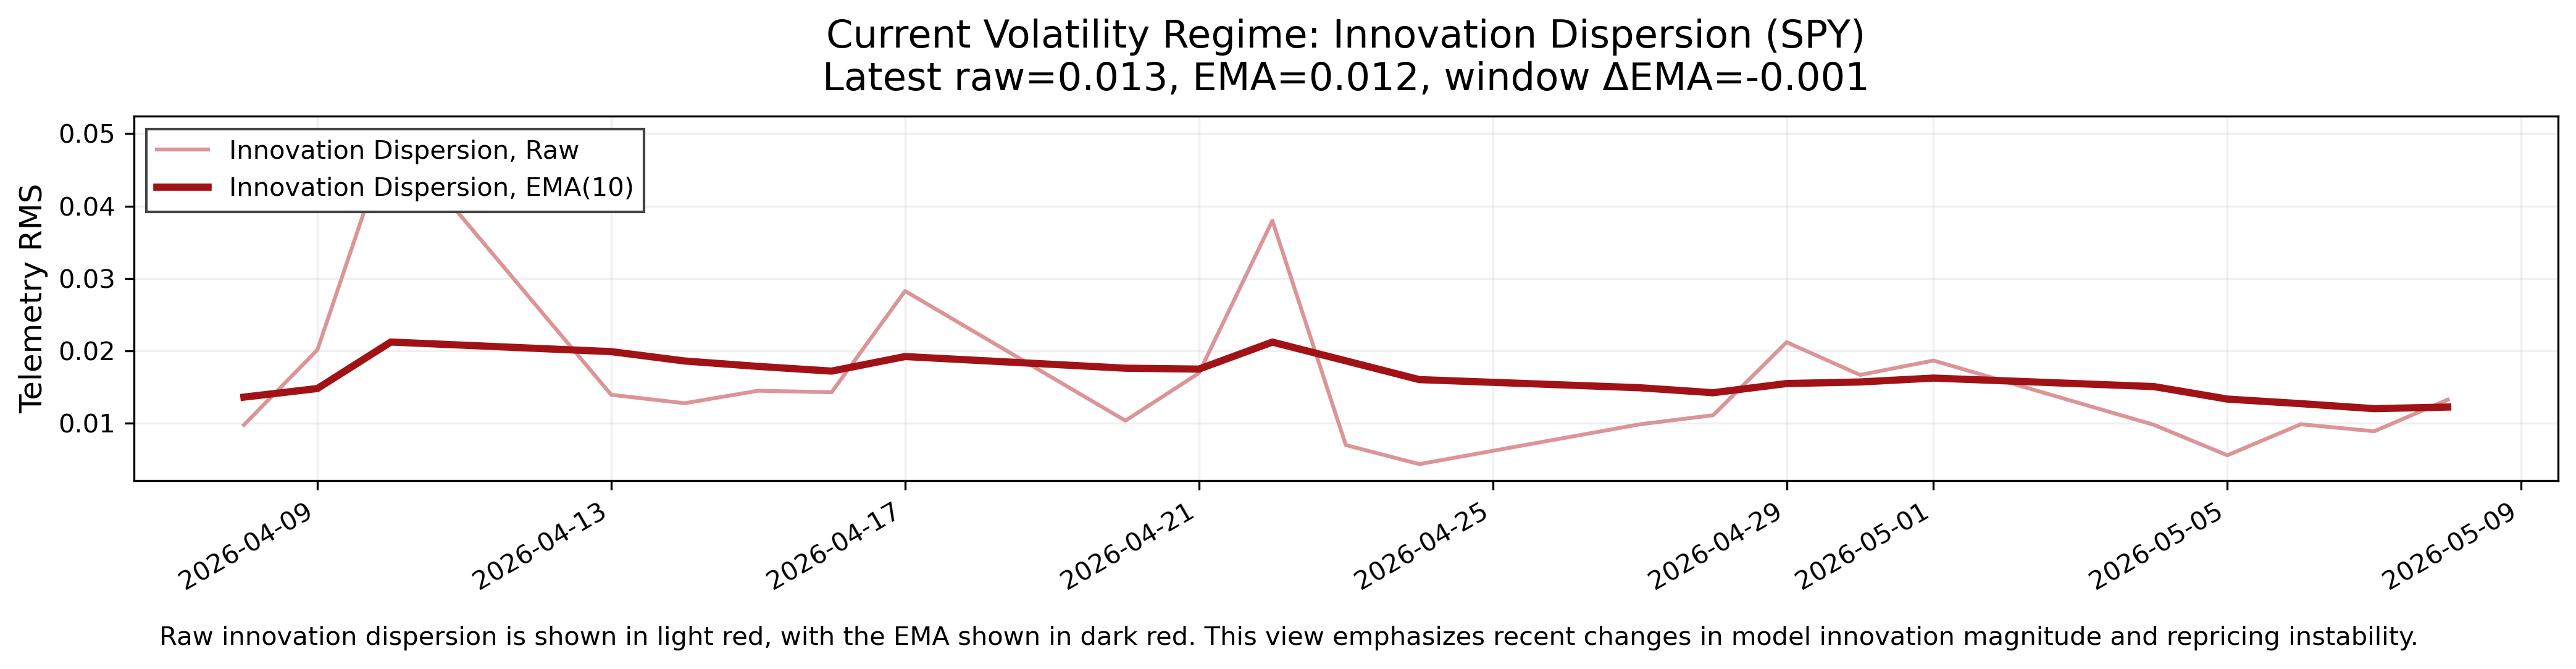
Volatility conditions remain in an expanding regime, with realized market behavior continuing to diverge modestly from prior expectation structure. Because the volatility signal reflects model innovation magnitude, the current environment is characterized more by unstable repricing and structural expectation adjustment than volatility in isolation. Expectation paths across maturities are adjusting unevenly, with shorter windows reacting faster while longer windows remain comparatively slower-moving. This remains associated with reactive movement, transition instability, and reduced continuation reliability.
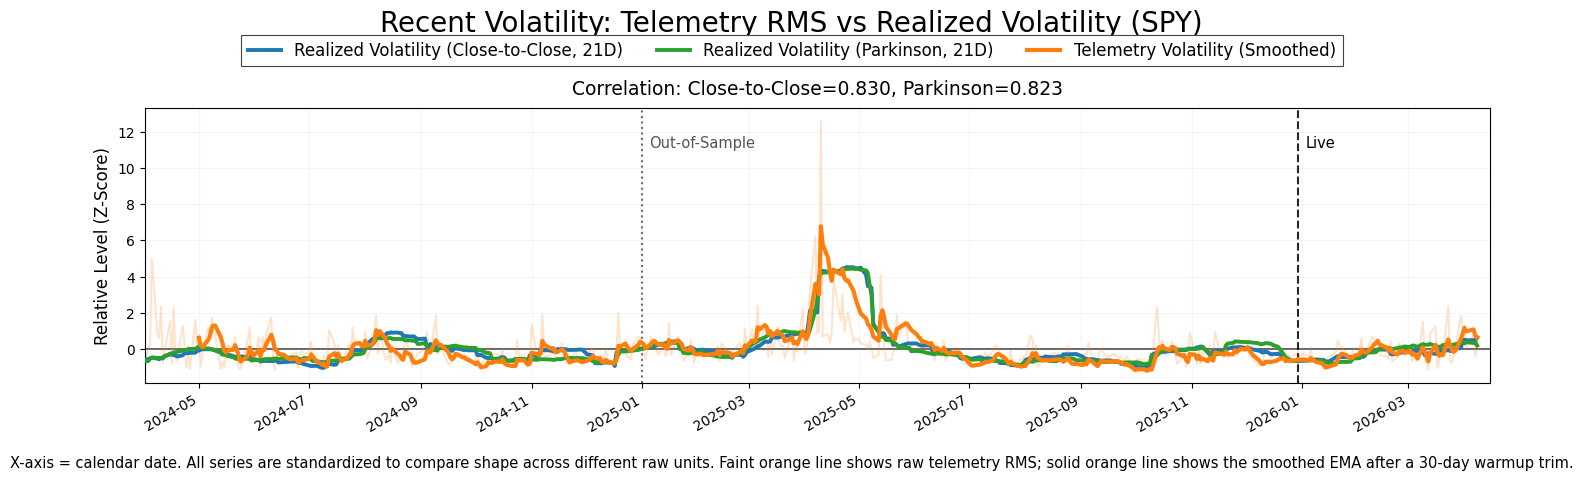
The following chart shows recent market volatility using the RMS of model error. The light line shows raw model error, while the darker line shows the smoothed trend. This view highlights short-term changes in variability and how current movement compares to its underlying trend.
Horizon-Averaged Forward Expectations
Near-Term (~2–4 weeks)
- State: Mixed
- Uncertainty: Tight
- Interpretation: Near-term expectations are strengthening through faster local repricing, though movement remains reactive and sensitive to short-horizon positioning changes.
Short-Term (~1–2 months)
- State: Mixed
- Uncertainty: Wide
- Interpretation: Short-term structure is weakening with wide dispersion, reflecting deteriorating continuation quality and more reversal-prone movement behavior.
Medium-Term (~2–4 months)
- State: Mixed
- Uncertainty: Moderate
- Interpretation: Medium-term structure continues weakening through smoother structural adjustment, suggesting persistent deterioration beneath shorter-horizon reactivity.
Long-Term (~6–12 months)
- State: Mixed
- Uncertainty: Moderate
- Interpretation: Long-term structure remains comparatively stable but lacks meaningful strengthening, leaving the broader anchor soft rather than decisively constructive.
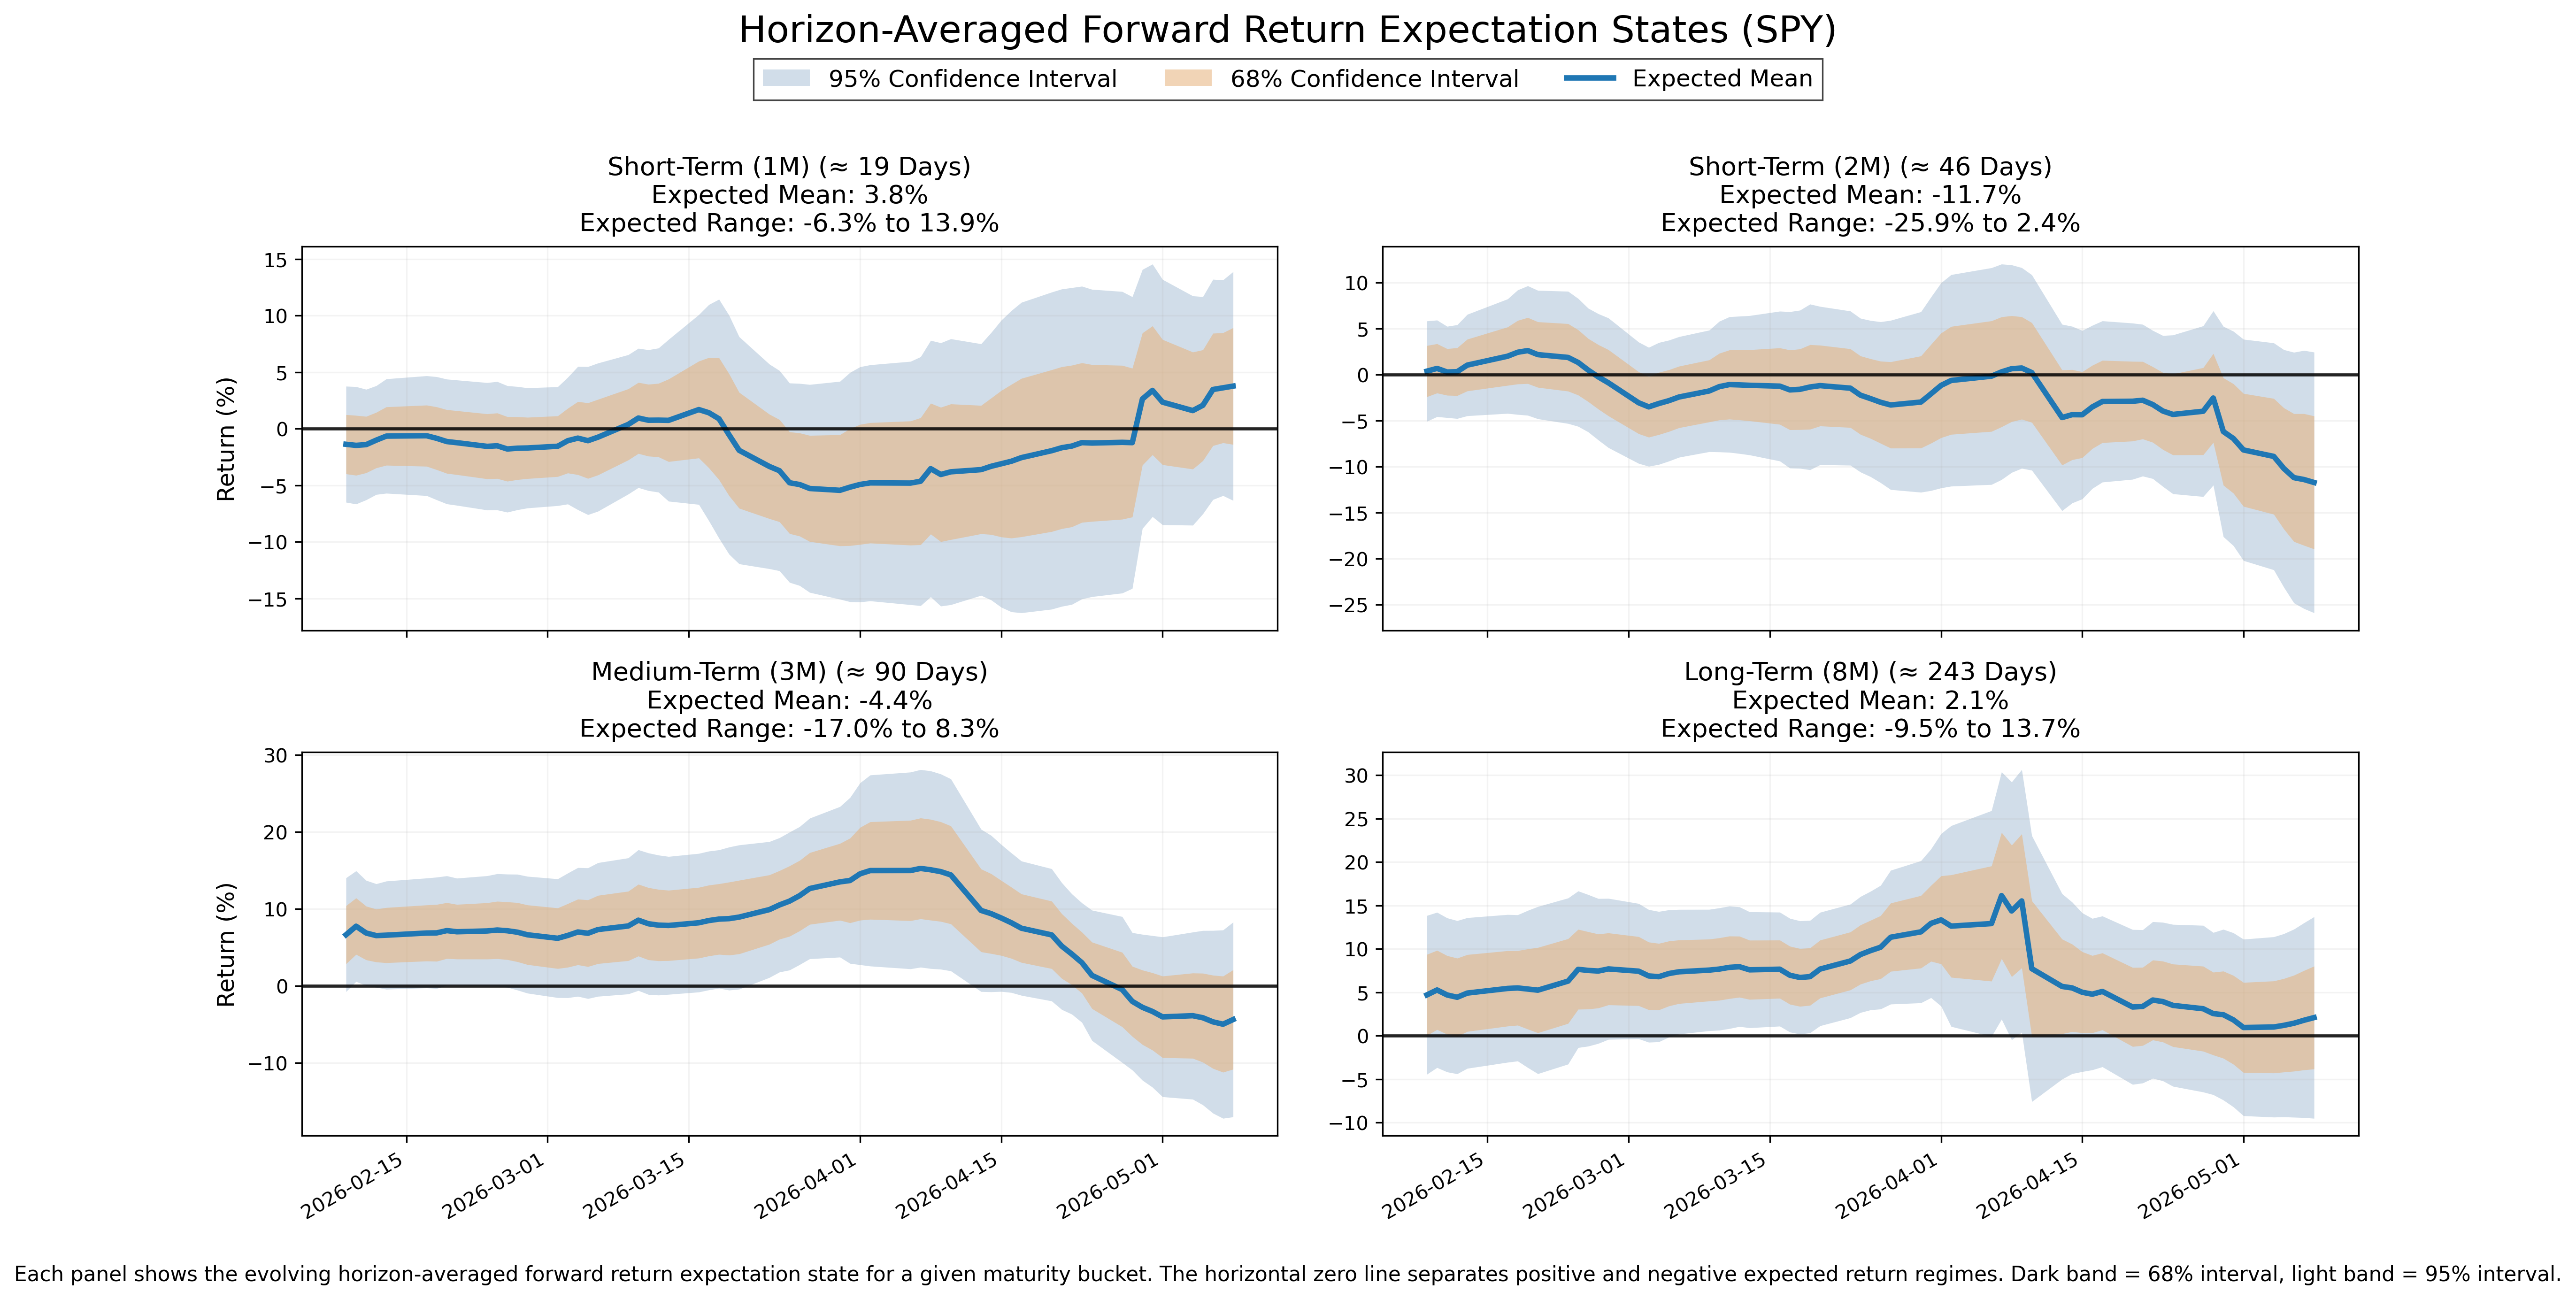
The following chart shows the evolution of horizon-averaged forward expectation states. Each panel represents a maturity window, with the central line showing the average expected return structure across that horizon bucket and shaded regions showing uncertainty.
Options Market Structure
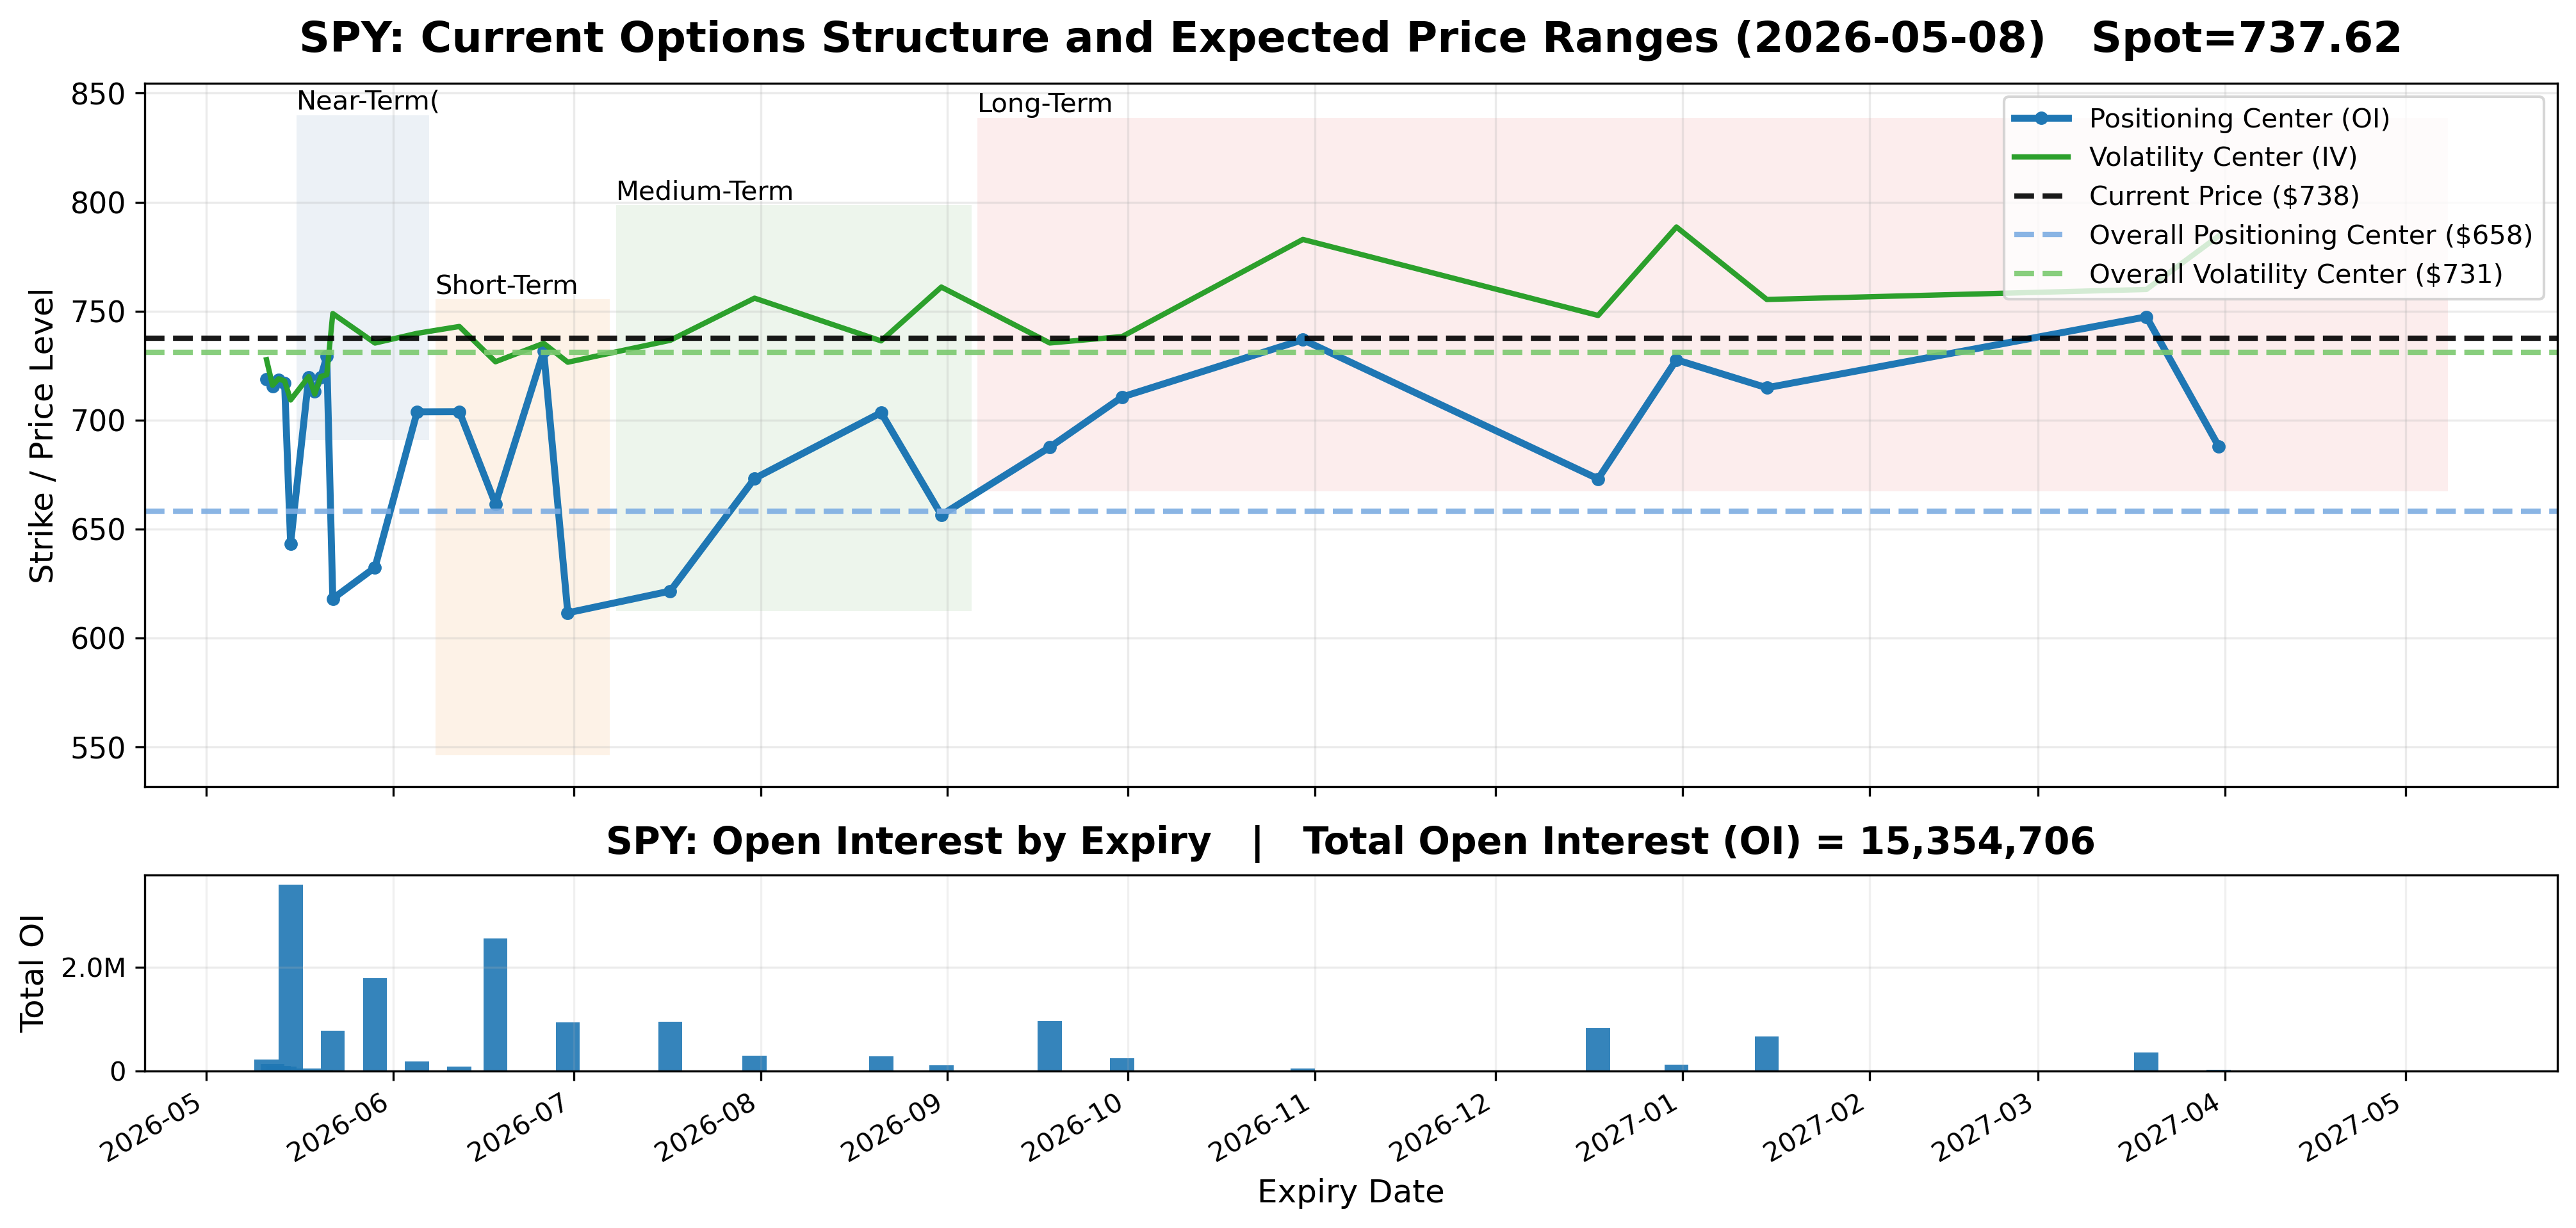
Current positioning remains concentrated across several nearby and monthly expiries, with the largest open-interest concentrations clustered in the May 15, June 18, and May 29 maturities. Additional positioning remains distributed across July, September, and later-dated expiries, producing a layered maturity structure rather than a single consolidated positioning profile. Positioning and implied volatility centers remain separated across maturities, reflecting segmented structural behavior and uneven repricing across the surface rather than uniform alignment. Longer-duration participation remains present, though near-term expiry concentration currently dominates the local structure.
The following chart shows today’s options market structure across expiration dates. Each point represents a future expiry, with positioning (open interest) and volatility (implied volatility) centers derived from current options data. Shaded regions show the expected price ranges for each horizon based on current market conditions. This is a cross-sectional view at a single point in time, not a time-series.
Bottom Line
The current market environment is characterized by expanding repricing instability, reactive short-horizon behavior, weakening short- and medium-term structure, and comparatively more stable long-term positioning. Cross-horizon alignment remains conflicted, with no complete directional alignment across maturities.
Structural evolution remains unresolved rather than convergent. Short-term and medium-term directional dynamics continue weakening, while long-term structure has not transitioned decisively into the same directional state. Directional alignment therefore remains uncertain due to conflicting or unstable cross-horizon dynamics.
This environment generates price behavior that is increasingly path-dependent, where movement quality depends more on repricing sequence and structural instability than persistent directional continuation alone. Faster short-horizon adjustment alongside smoother medium-term deterioration reflects uneven repricing within the same evolving maturity structure.
Decision conditions remain sensitive to timing, horizon selection, and continuation quality. Variability-driven outcomes currently dominate directional reliability, reducing consistency for positioning dependent on stable trend persistence while favoring structures capable of absorbing unstable repricing and changing path behavior.
In plain English, the market still looks unstable beneath the surface even though price remains elevated. Shorter horizons are reacting quickly, the short- and medium-term structure is weakening, and the long-term backdrop has not fully broken down. That leaves the market in a conflicted state where movement can remain active, but clean directional follow-through remains less reliable.
Model Calibration Assessment
This report is generated from the output of a proprietary quantitative system that measures current options market structure, conditions, and forward expectations. This section evaluates the correctness and calibration of the underlying model.
The model remains calibrated based on the current validation data.
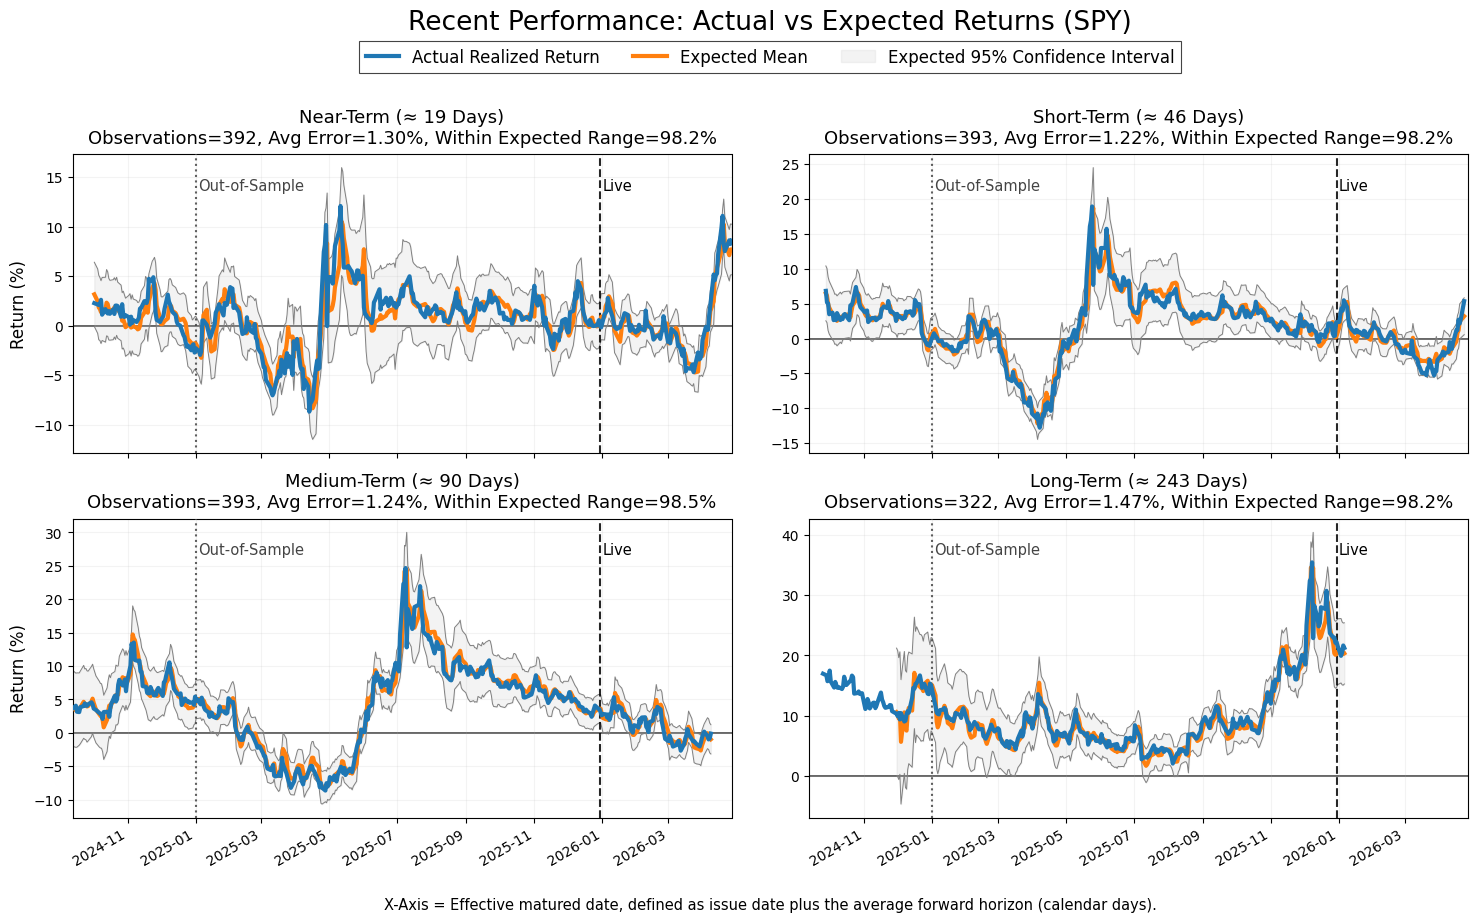
Across all four forward horizons, realized returns continue to remain inside the modeled 95% confidence intervals at a consistently high rate, with coverage remaining near or above expected levels. Error magnitude also remains stable across horizons, with no visible expansion in average forecast error during either the out-of-sample or live periods.
The realized return series continues to track the modeled expected mean without persistent directional separation, which indicates no obvious systematic bullish or bearish bias. Short-term deviations continue to mean-revert back toward the modeled structure rather than drift away from it over time.
The volatility signal also remains aligned with realized market volatility. The underlying RMS-based innovation measure continues to track both close-to-close and Parkinson realized volatility with strong correlation and without visible structural divergence. Large volatility events continue to be captured directionally and temporally without evidence of persistent lag or decoupling.
Taken together, the current validation evidence remains consistent with a stable and calibrated system rather than a degrading or drifting model.
If you find this useful, you can support the work here. I’d also really appreciate hearing how you’re using this market data: any feedback helps me make this more useful in real workflows.
Weekly financial telemetry reports. Delivered Sundays.