SPY Financial Telemetry Report
Week Ending 2026-05-22
Published 2026-05-24
Market-implied expectations derived from options market structure.
This report is generated from the output of a proprietary quantitative system that measures market structure, conditions, and forward expectations, translating system measurements into descriptive statements about the market environment.
Executive Summary
Market behavior remains conflicted across timeframes. Short-term movement has become more reactive again after a period of stabilization, while longer-duration expectations continue to recover from the earlier repricing event. Recent movement shows signs of renewed instability beneath the surface, with shorter horizons weakening while long-term structure continues to strengthen gradually. Price movement remains uneven rather than cleanly directional, and different timeframes are still pointing in different directions. The environment reflects partial recovery from prior instability rather than a fully resolved directional regime.
Regime: Reactive and conflicted
Near-Term (~2 to 4 weeks): Weakening short-term structure
Short-Term (~1 to 2 months): Recovering but unstable
Medium-Term (~2 to 4 months): Transitional and unresolved
Long-Term (~6 to 12 months): Gradually strengthening
Structure: Cross-horizon disagreement
Market State
- Expanding volatility conditions reflect renewed divergence between realized market behavior and prior expectation structure, increasing the instability of short-term repricing behavior.
- Near-term expectations are weakening again, with movement becoming more reactive and continuation quality deteriorating despite relatively tight uncertainty conditions.
- Short-term structure remains negative but is recovering, reflecting partial stabilization after earlier directional deterioration while still exhibiting elevated sensitivity to new information.
- Medium-term expectations remain unresolved, with behavior characterized by incomplete directional follow-through and limited structural clarity across intermediate maturities.
- Long-term expectations continue to strengthen gradually, reflecting slower-moving stabilization in broader structural expectations despite ongoing short-horizon instability.
- Cross-horizon structure remains conflicted, with no complete directional alignment across horizons.
- The overall environment remains transitional rather than trend-confirming, as shorter maturities weaken while longer maturities continue to stabilize.
Market Insights
- Short-term moves remain vulnerable to reversal, which increases timing sensitivity and reduces directional reliability for fast-moving positioning as flows remain fragmented across nearby maturities.
- Longer-duration expectations continue to stabilize while near-term behavior weakens, which creates disagreement between execution horizons and reduces alignment reliability as different maturities absorb information at different speeds.
- Expanding volatility conditions increase variability around otherwise stable expectation paths, which reduces holding-period reliability as repricing behavior becomes more reactive across maturities.
- Intermediate horizons continue to show incomplete directional resolution, which limits persistence quality for medium-duration positioning as positioning concentration remains uneven across the surface.
- Recent movement reflects variability-driven behavior more than clean directional expansion, which increases sensitivity to path dependency as repricing remains structurally unresolved across horizons.
What Changed This Week
Near-term expectations weakened further this week while uncertainty narrowed slightly, reflecting deterioration in short-horizon continuation quality despite tighter expected ranges.
Short-term expectations improved materially relative to the prior snapshot while uncertainty narrowed, reflecting partial stabilization after earlier directional weakness.
Medium-term expectations remained broadly stable, though uncertainty widened modestly, reflecting unresolved intermediate structure with slightly increasing variability.
Long-term expectations strengthened further while uncertainty widened, reflecting improving longer-duration structure alongside continued instability in broader repricing conditions.
Volatility Regime
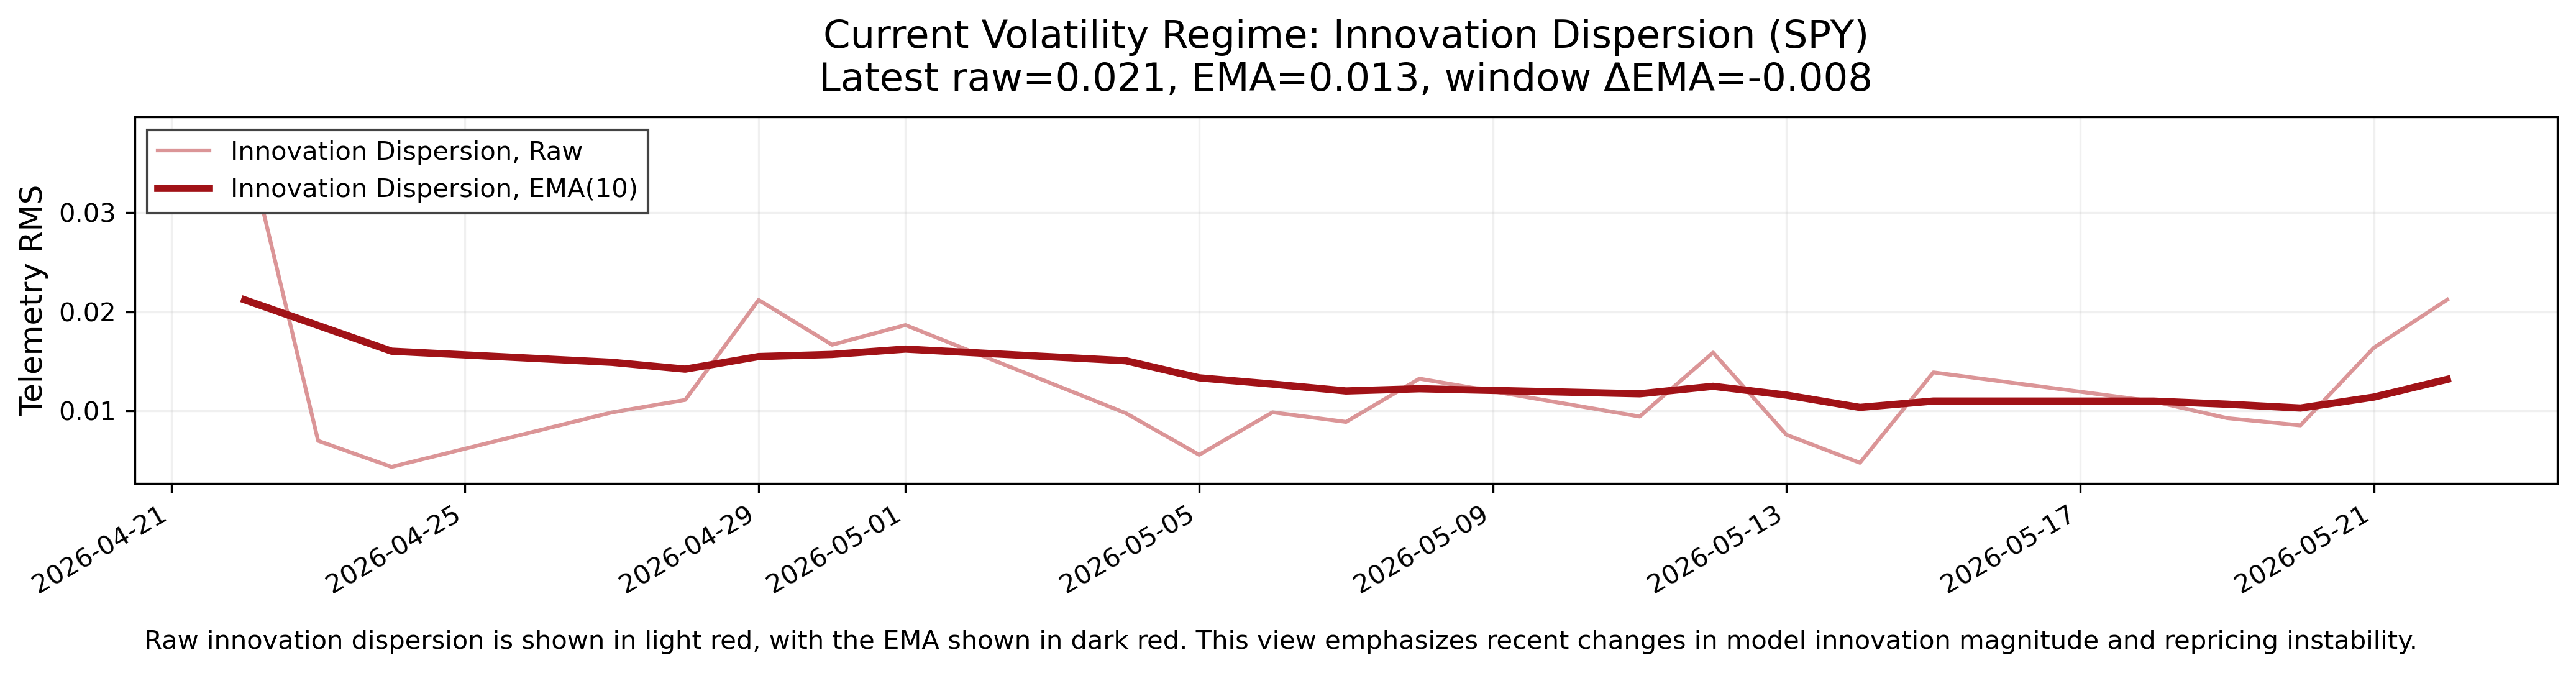
The volatility signal remains in an expanding regime, with recent innovation magnitude rising above the smoothed underlying trend despite the broader volatility baseline continuing to decline. This reflects renewed divergence between realized market behavior and prior expectation structure after a period of relative stabilization. Current conditions are consistent with reactive repricing behavior rather than orderly directional continuation, particularly across shorter maturities. While the broader volatility environment has calmed materially from the earlier dislocation period, recent movement suggests instability remains active beneath the surface rather than fully resolved.
The following chart shows recent market volatility using the RMS of model error. The light line shows raw model error, while the darker line shows the smoothed trend. This view highlights short-term changes in variability and how current movement compares to its underlying trend.
Horizon-Averaged Forward Expectations
Near-Term (~2–4 weeks)
• State: Mixed
• Uncertainty: Tight
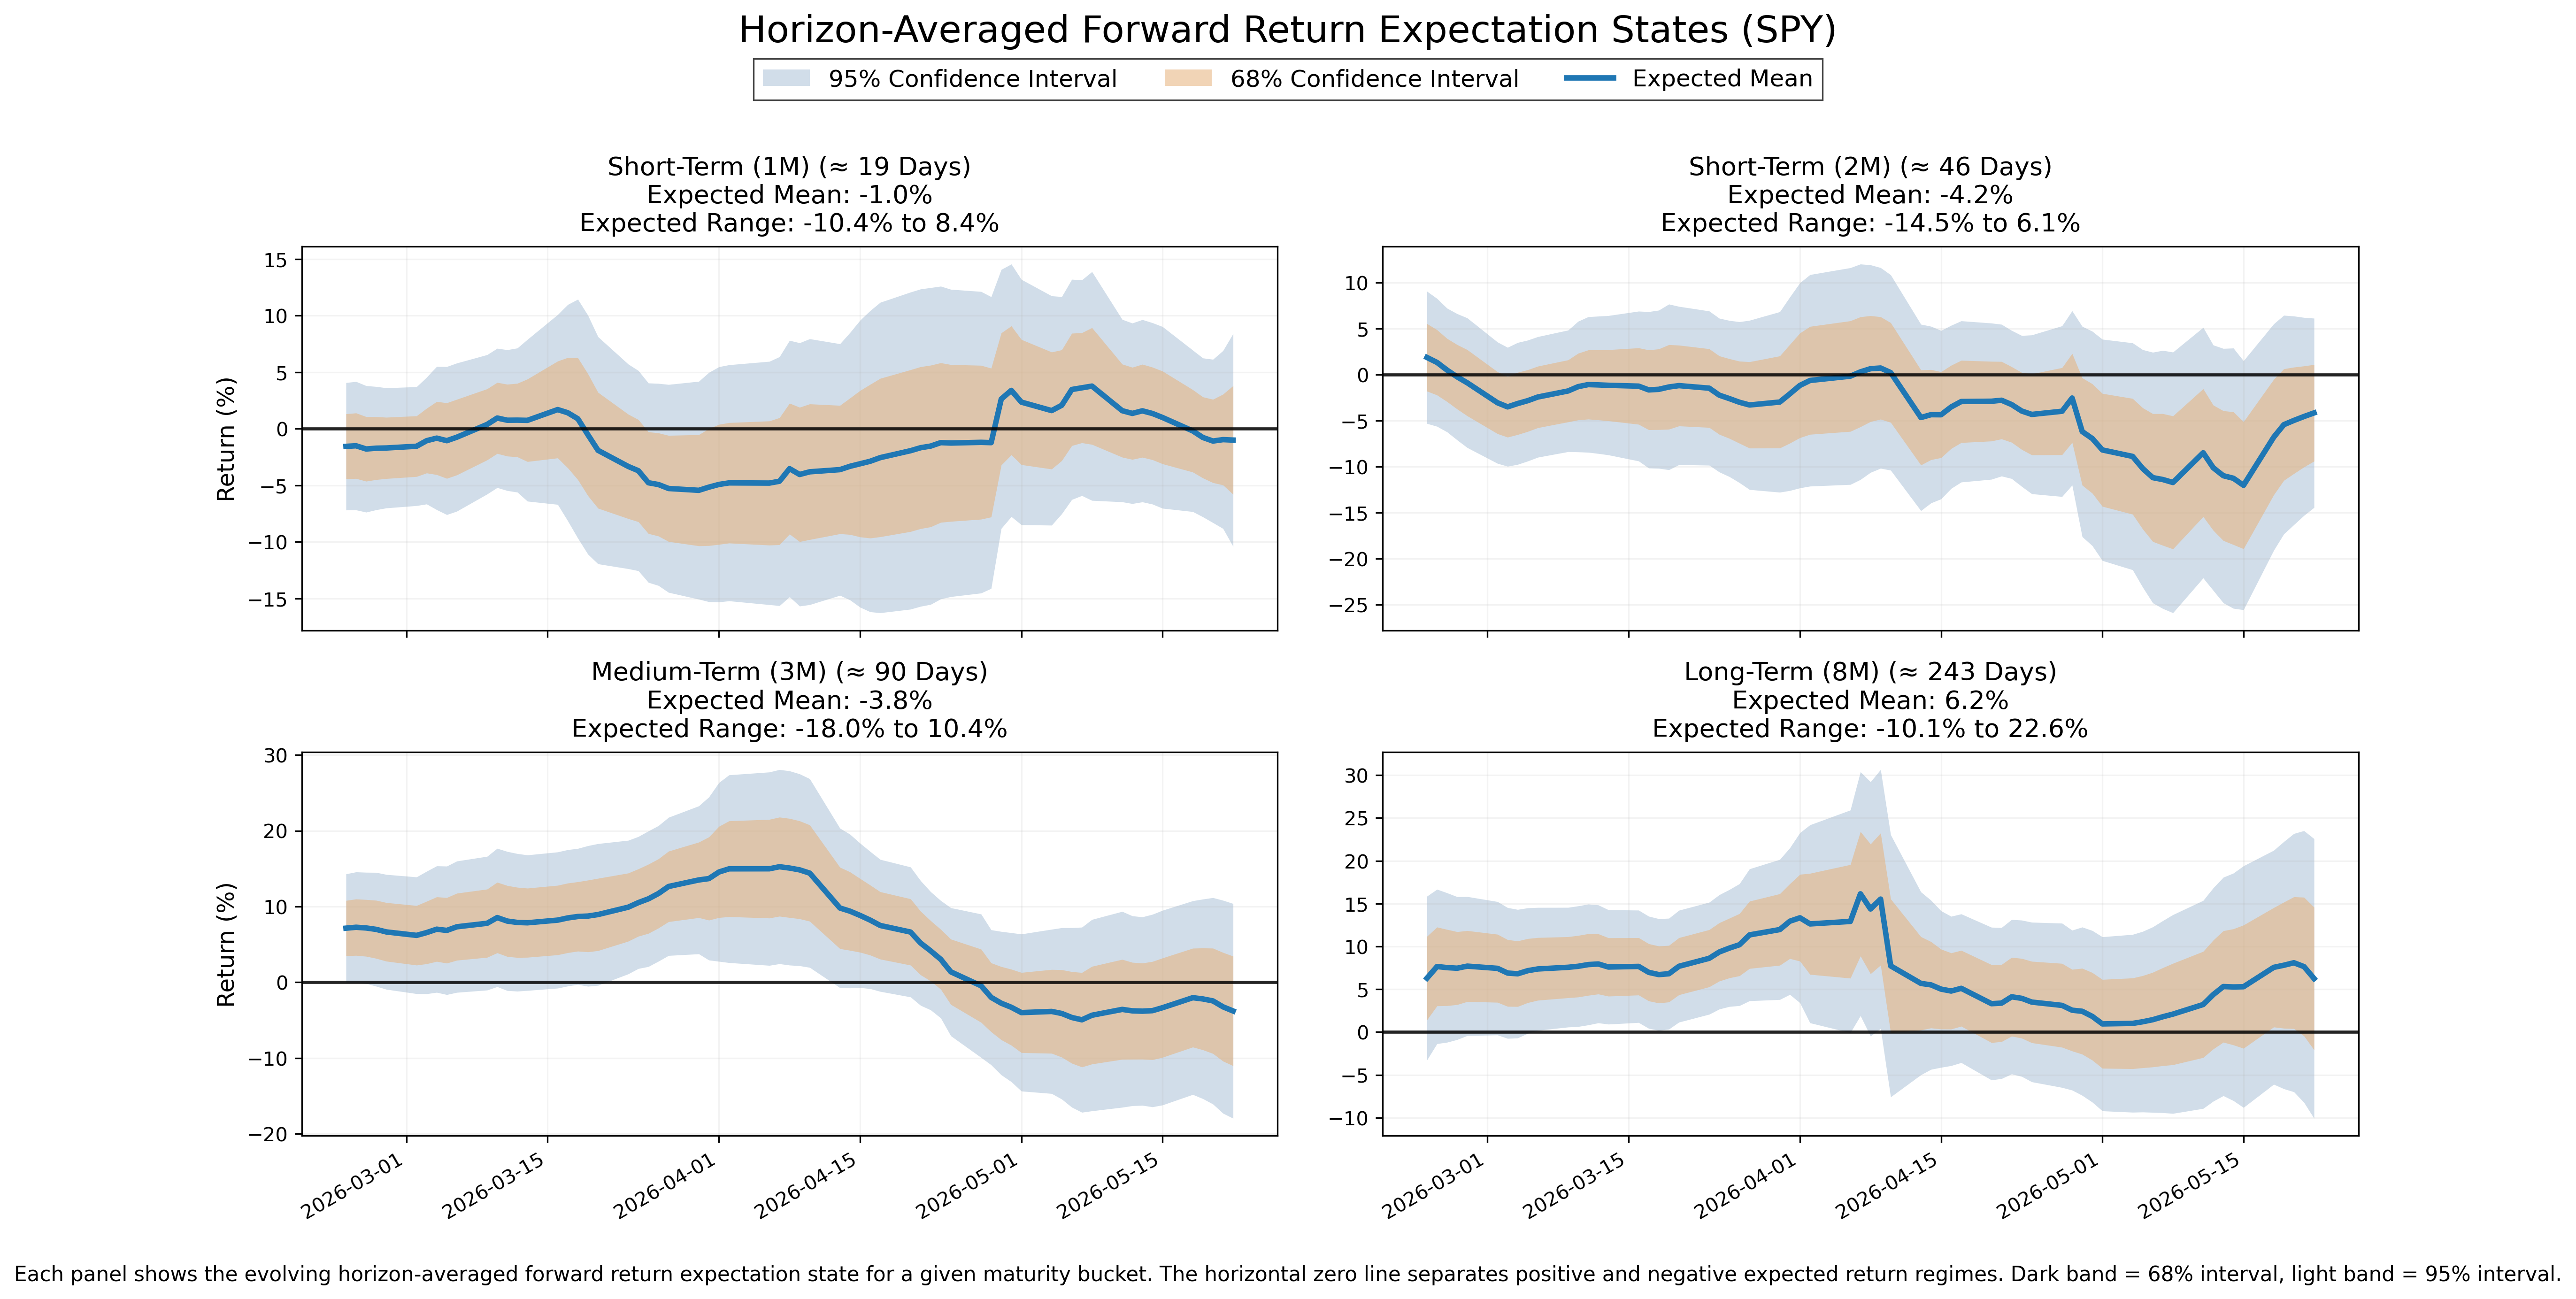
• Interpretation: Near-term structure is weakening, with increasingly reactive short-horizon behavior and deteriorating continuation quality despite relatively contained uncertainty.
Short-Term (~1–2 months)
• State: Mixed
• Uncertainty: Moderate
• Interpretation: Short-term structure remains negative but is recovering, with stabilization beginning to emerge after earlier directional deterioration while movement remains sensitive to repricing instability.
Medium-Term (~2–4 months)
• State: Mixed
• Uncertainty: Moderate
• Interpretation: Medium-term behavior remains transitional and unresolved, with limited directional persistence and incomplete structural stabilization across intermediate maturities.
Long-Term (~6–12 months)
• State: Mixed
• Uncertainty: Wide
• Interpretation: Long-term structure continues to strengthen gradually, though wide uncertainty conditions reflect continued sensitivity to broader repricing behavior and unresolved cross-horizon alignment.
The following chart shows the evolution of horizon-averaged forward expectation states. Each panel represents a maturity window, with the central line showing the average expected return structure across that horizon bucket and shaded regions showing uncertainty.
Options Market Structure
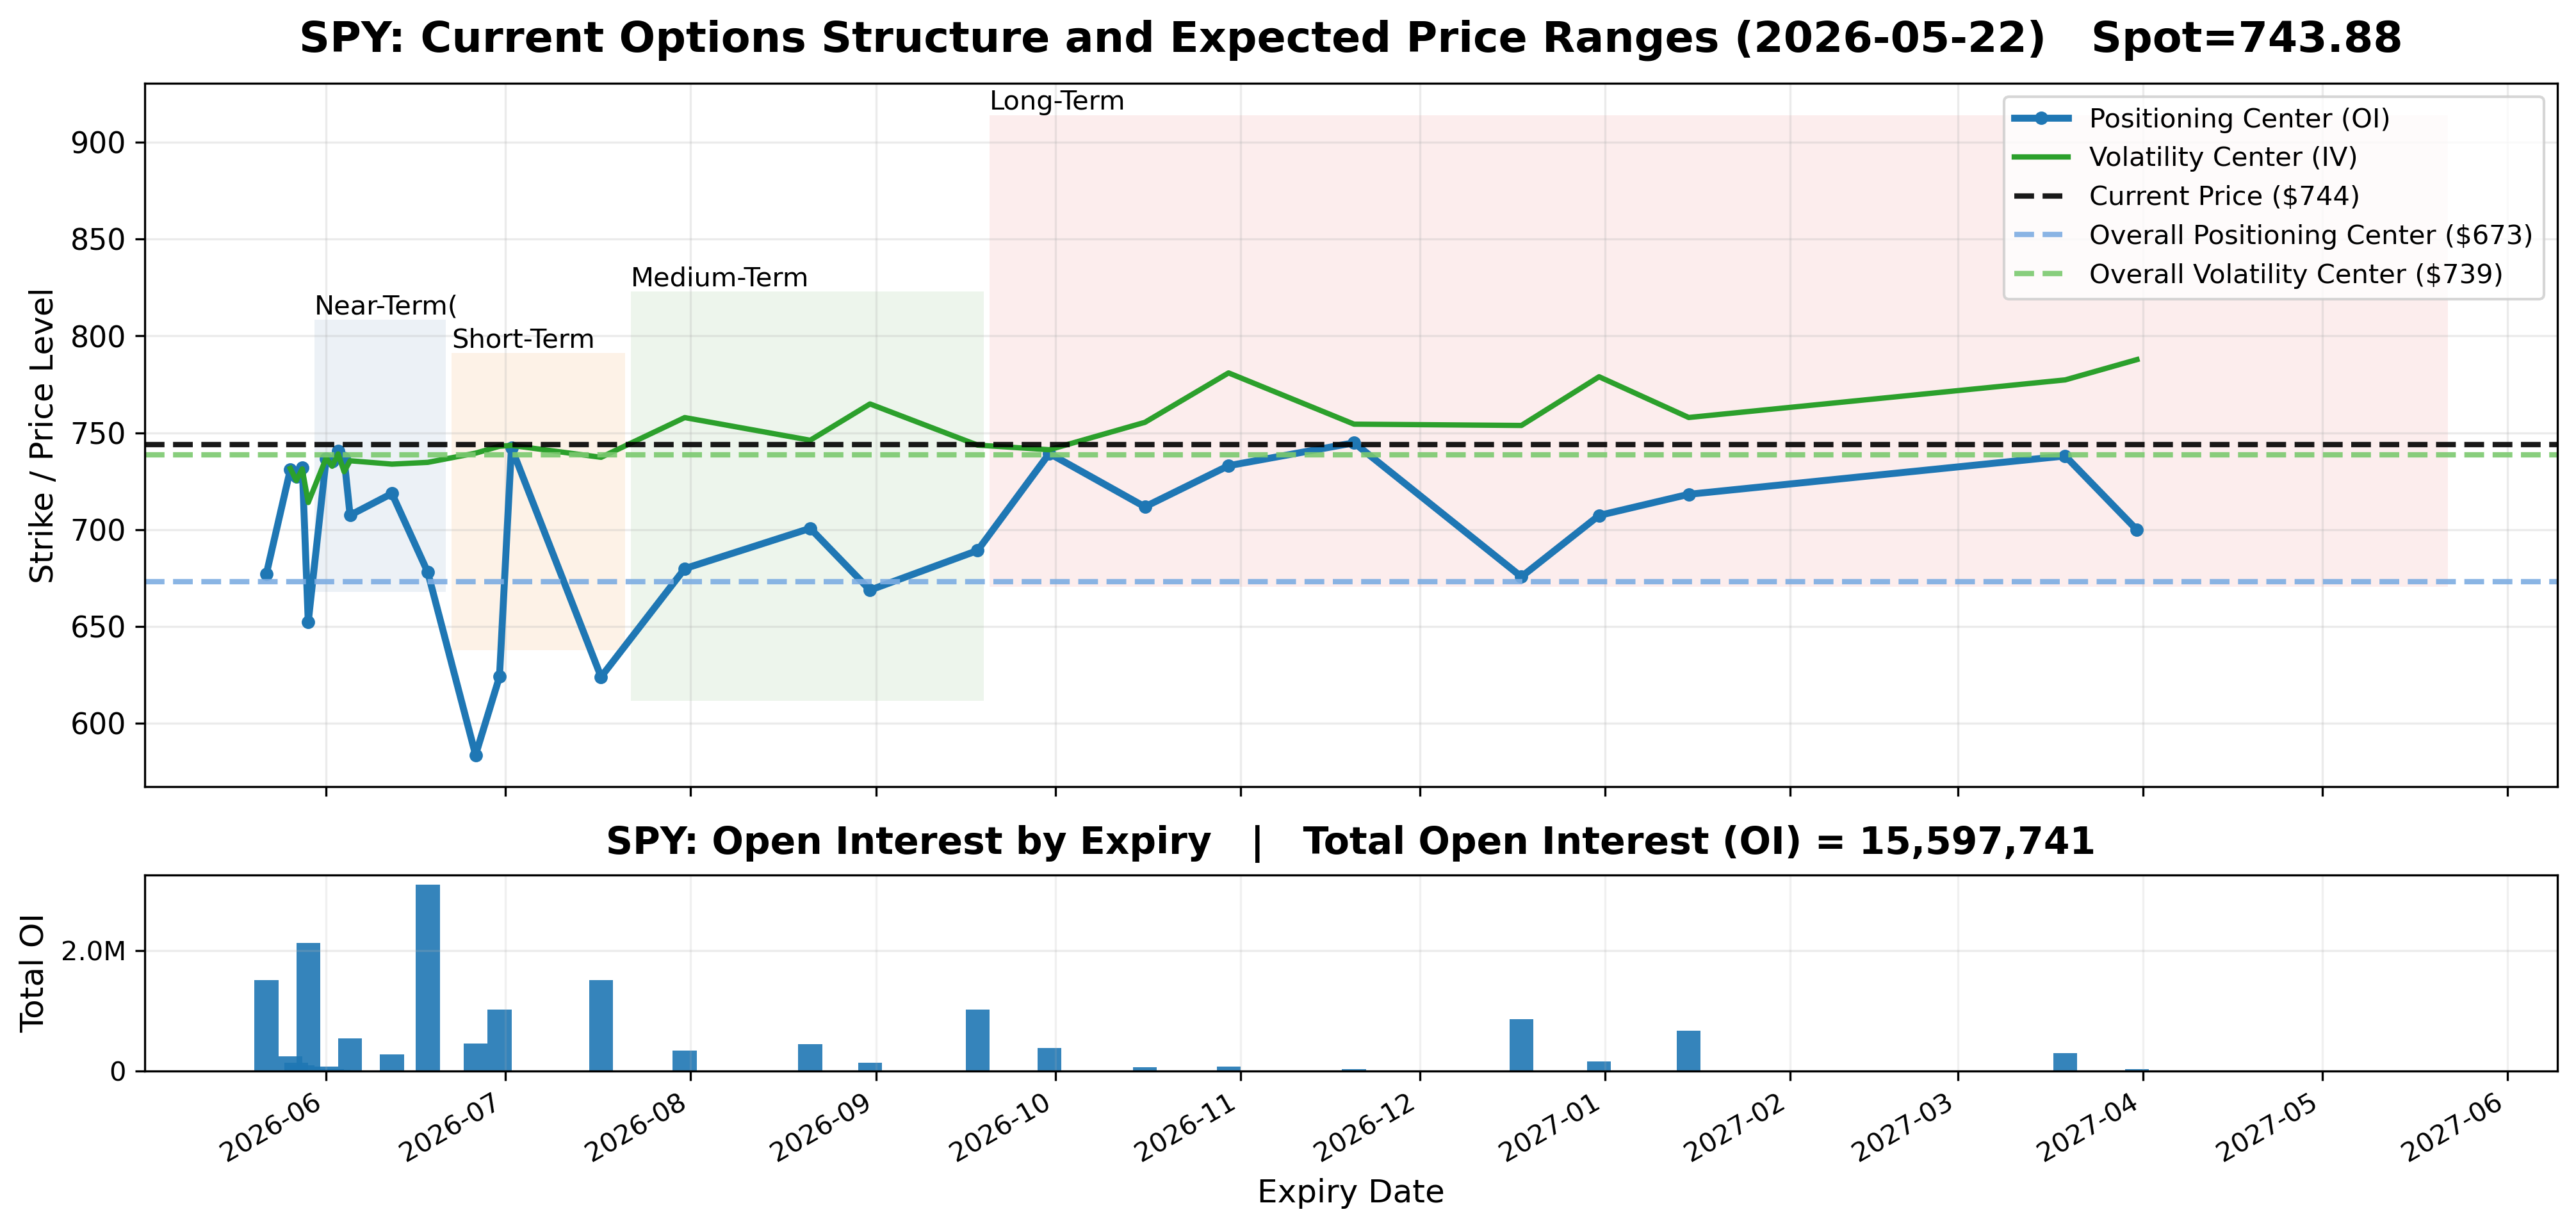
Current positioning remains concentrated in near- and intermediate-dated expiries, with particularly large open-interest concentrations clustered around late May, June, and July maturities. Structural participation remains heavily layered across short-duration expiries while longer-dated positioning continues to maintain meaningful participation deeper into the curve. Positioning concentration remains fragmented rather than isolated to a single maturity cluster, reflecting broad participation across multiple expiration windows rather than a narrowly concentrated surface state.
The following chart shows today’s options market structure across expiration dates. Each point represents a future expiry, with positioning (open interest) and volatility (implied volatility) centers derived from current options data. Shaded regions show the expected price ranges for each horizon based on current market conditions. This is a cross-sectional view at a single point in time, not a time-series.
Bottom Line
The current environment remains structurally conflicted. Near-term expectations have weakened again while long-term structure continues to stabilize gradually, and volatility conditions remain reactive rather than fully compressed. Recent movement reflects renewed instability beneath the surface despite broader moderation from the earlier dislocation regime.
Cross-horizon alignment remains unresolved rather than directional. Short-term structure has begun recovering from prior weakness while long-term expectations continue strengthening incrementally, but medium-term structure remains unresolved and near-term behavior has deteriorated again. Current dynamics do not yet reflect a fully coherent directional transition across maturities.
Price behavior in this environment remains characterized more by uneven traversal and repricing variability than by persistent directional expansion. Continuation quality remains inconsistent across horizons, with shorter maturities reacting more rapidly while longer-duration structure evolves more gradually. Variability continues to dominate outcomes more than clean trend persistence.
Current conditions increase timing sensitivity relative to positioning sensitivity. Short-duration positioning remains disadvantaged by reactive movement and reduced continuation reliability, while longer-duration positioning conditions remain more structurally stable but still affected by unresolved cross-horizon disagreement. Variability-driven risk continues to dominate directional certainty.
In plain English, the market looks calmer than it did during the major repricing event earlier this year, but it still does not look fully settled. Short-term behavior has become shaky again, while longer-term expectations continue trying to recover. Different parts of the market are still telling different stories, so movement remains uneven rather than cleanly directional.
Model Calibration Assessment
This report is generated from the output of a proprietary quantitative system that measures current options market structure, conditions, and forward expectations. This section evaluates the correctness and calibration of the underlying model.
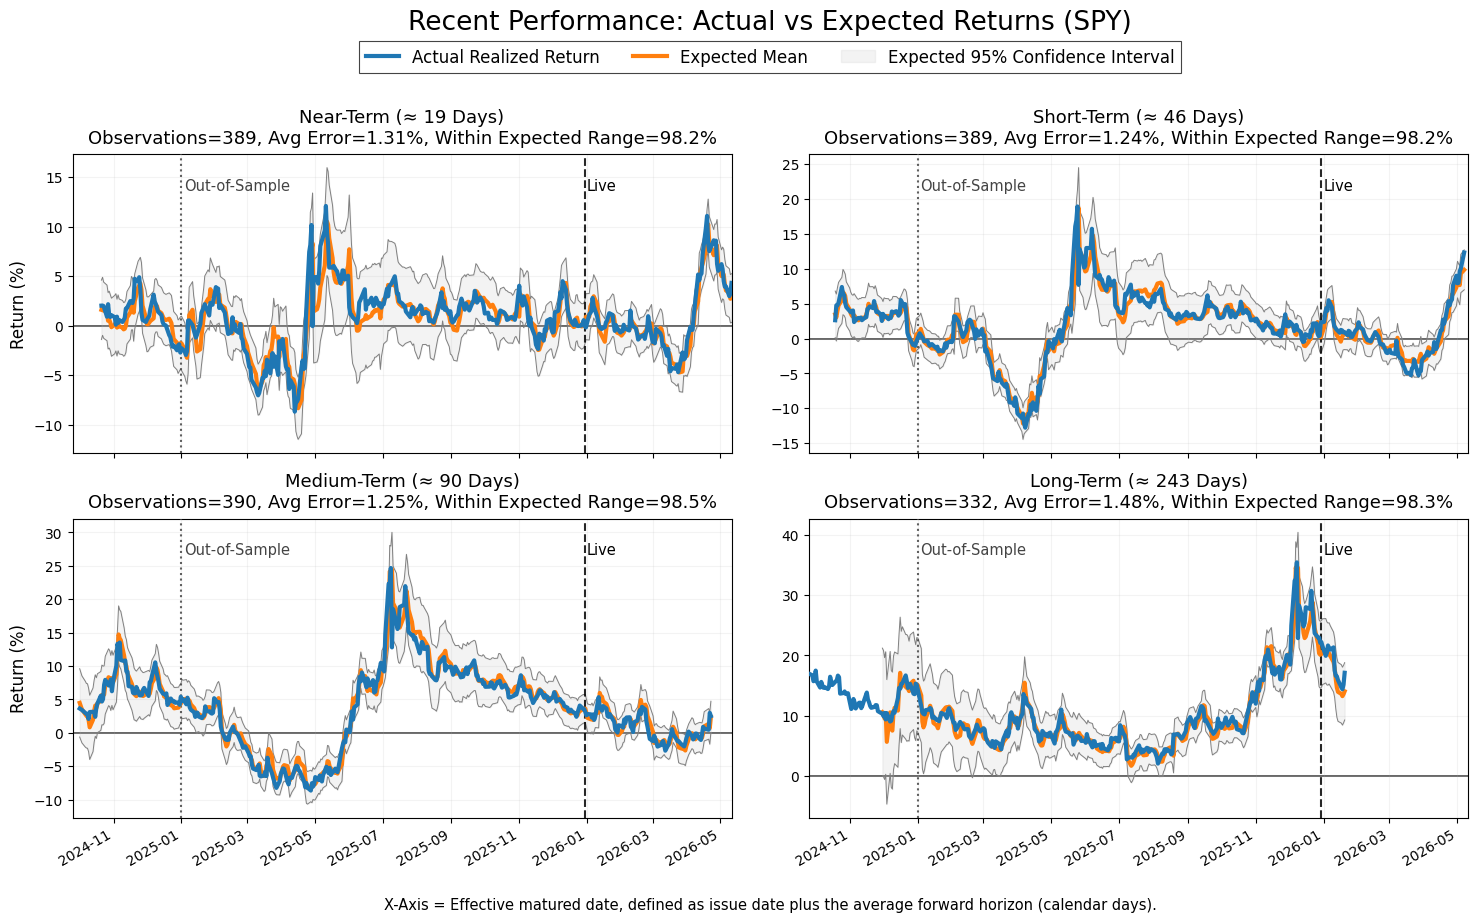
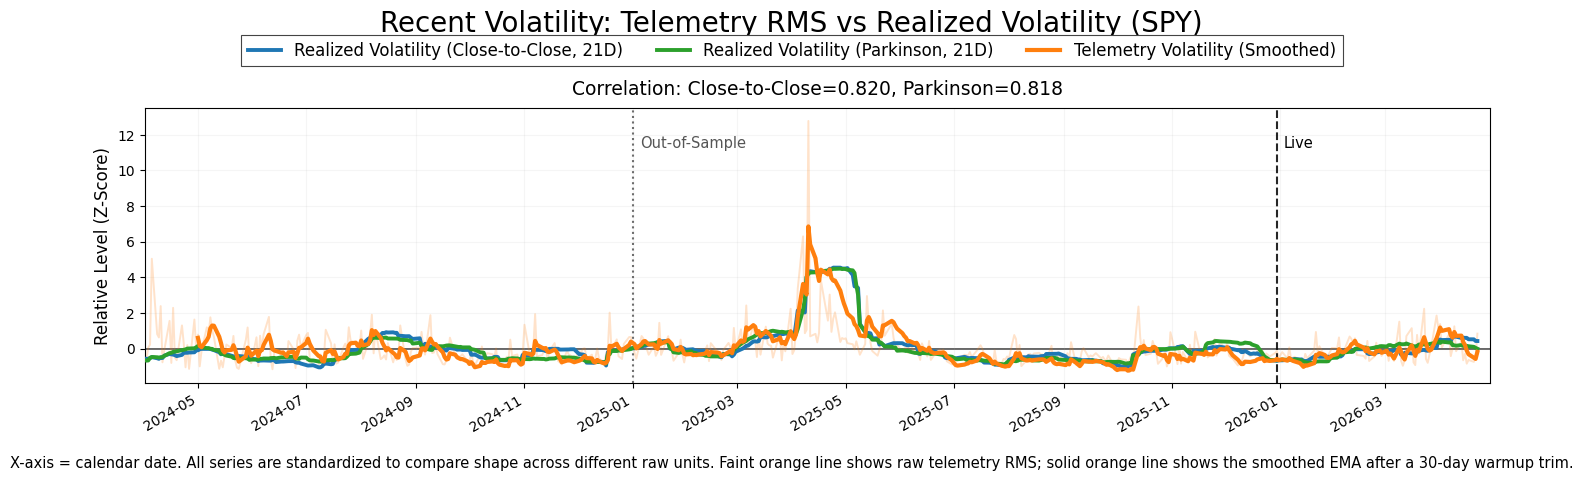
The model remains calibrated based on current validation behavior. Realized returns across all maturity horizons continue to remain within expected confidence intervals at rates consistent with or slightly above the intended coverage range, with no visible breakdown in interval behavior during either out-of-sample or live operation. Error magnitude remains stable across horizons, and there is no persistent directional bias or visible drift between realized outcomes and expected mean structure.
The volatility signal also remains well aligned with realized market behavior. Periods of elevated realized volatility correspond closely with increases in the innovation measure, indicating that the system continues to detect periods where realized market movement diverges materially from prior expectation structure. The strongest innovation expansion aligns with the major 2025 repricing event, while subsequent compression and re-expansion phases continue to track realized volatility behavior consistently across both close-to-close and Parkinson volatility measures.
Overall, the validation behavior remains internally consistent, stable across horizons, and structurally aligned with observed market conditions.
If you find this useful, you can support the work here. I’d also really appreciate hearing how you’re using this market data: any feedback helps me make this more useful in real workflows.