SPY Financial Telemetry Report
Week Ending 2026-05-29
Published 2026-05-31
Market-implied expectations derived from options market structure.
This report is generated from the output of a proprietary quantitative system that measures market structure, conditions, and forward expectations, translating system measurements into descriptive statements about the market environment.
Executive Summary
SPY remains unstable beneath the surface. Short-term movement is still reactive and weakening. The broader structure is improving across the short-, medium-, and long-term horizons, but that improvement is not current alignment. The near-term horizon is moving against the broader structure, so price movement remains fragmented rather than orderly.
Regime: Expanding instability
Near-Term (~2 to 4 weeks): Mixed but weakening
Short-Term (~1 to 2 months): Mixed, negative but recovering
Medium-Term (~2 to 4 months): Mixed, neutral but improving
Long-Term (~6 to 12 months): Mixed, constructive but unconfirmed
Structure: Developing positive alignment, near-term conflicted
Market State
- Volatility is expanding because current model error is above its smoothed trend, reflecting unstable repricing where realized behavior is diverging from prior expectation structure.
- Near-term structure is weakening, showing reactive short-horizon behavior where continuation quality remains poor even though the current uncertainty band is relatively tight.
- Short-term structure remains negative but is recovering, creating easing defensive pressure without establishing current directional alignment.
- Medium-term structure is neutral but improving, reflecting firmer intermediate behavior with moderate uncertainty still limiting persistence.
- Long-term behavior is strengthening, giving the broader structure a constructive anchor with wide uncertainty keeping confirmation incomplete.
- Cross-horizon structure remains conflicted, with no complete directional alignment across horizons.
- Conditional positive alignment is developing across the short-, medium-, and long-term structure. Near-term behavior is opposing that alignment and keeping the transition conflicted at the execution horizon.
Market Insights
- Directional moves show uneven follow-through, which reduces signal reliability and shortens useful holding-period tolerance as near-term weakness conflicts with improving broader structure.
- Short-horizon execution remains timing-sensitive, which weakens broad positioning reliability as different maturities are repricing at different speeds.
- Clean trend development remains constrained, which makes persistent directional strategies harder to sustain as current cross-horizon structure remains conflicted.
- Variability-driven risk remains elevated, which increases fragility for path-dependent strategies as model innovations show realized behavior diverging from prior expectations.
What Changed This Week
Near-term expectations weakened and the near-term uncertainty band widened, showing that the fastest horizon became more defensive while also becoming less stable.
Short-term expectations improved and the uncertainty band narrowed, leaving the horizon negative but recovering compared with the prior snapshot.
Medium-term expectations improved and the uncertainty band narrowed, shifting the middle horizon toward firmer neutral behavior.
Long-term expectations strengthened and the uncertainty band narrowed, reinforcing the constructive longer-horizon anchor while the current uncertainty state remains wide.
Volatility Regime
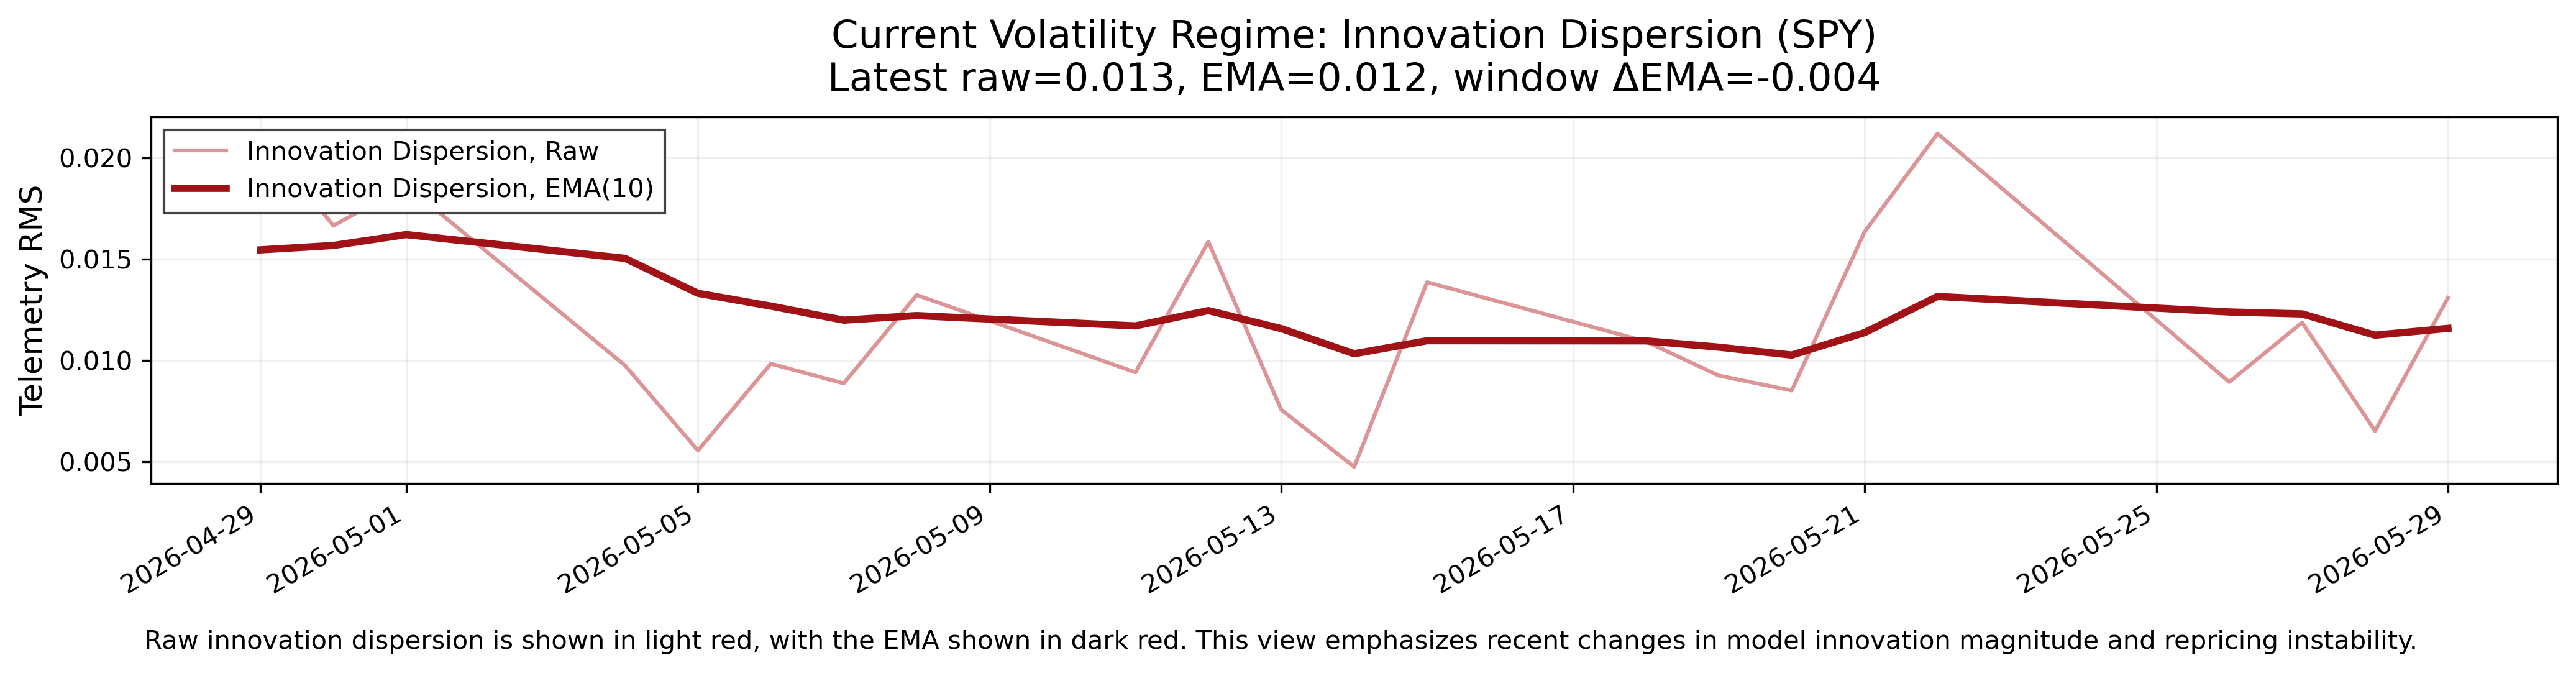
The volatility regime is expanding because raw model error is above its smoothed trend. The smoothed volatility trend is lower over the 30-day window, so the current condition reflects renewed short-term instability inside a broader cooling trend rather than a persistent volatility upswing.
In this system, volatility reflects the size of the gap between realized behavior and prior expectation structure. Current conditions show that recent market movement is diverging from what the prior structure described, forcing more frequent expectation adjustment.
This environment is more consistent with unstable repricing than orderly continuation. Price movement is associated with faster resets, weaker persistence, and more sensitivity to new information because the structure is still adjusting across maturities.
The following chart shows recent market volatility using the RMS of model error. The light line shows raw model error, while the darker line shows the smoothed trend. This view highlights short-term changes in variability and how current movement compares to its underlying trend.
Horizon-Averaged Forward Expectations
Near-Term (~2–4 weeks)
• State: Mixed
• Uncertainty: Tight
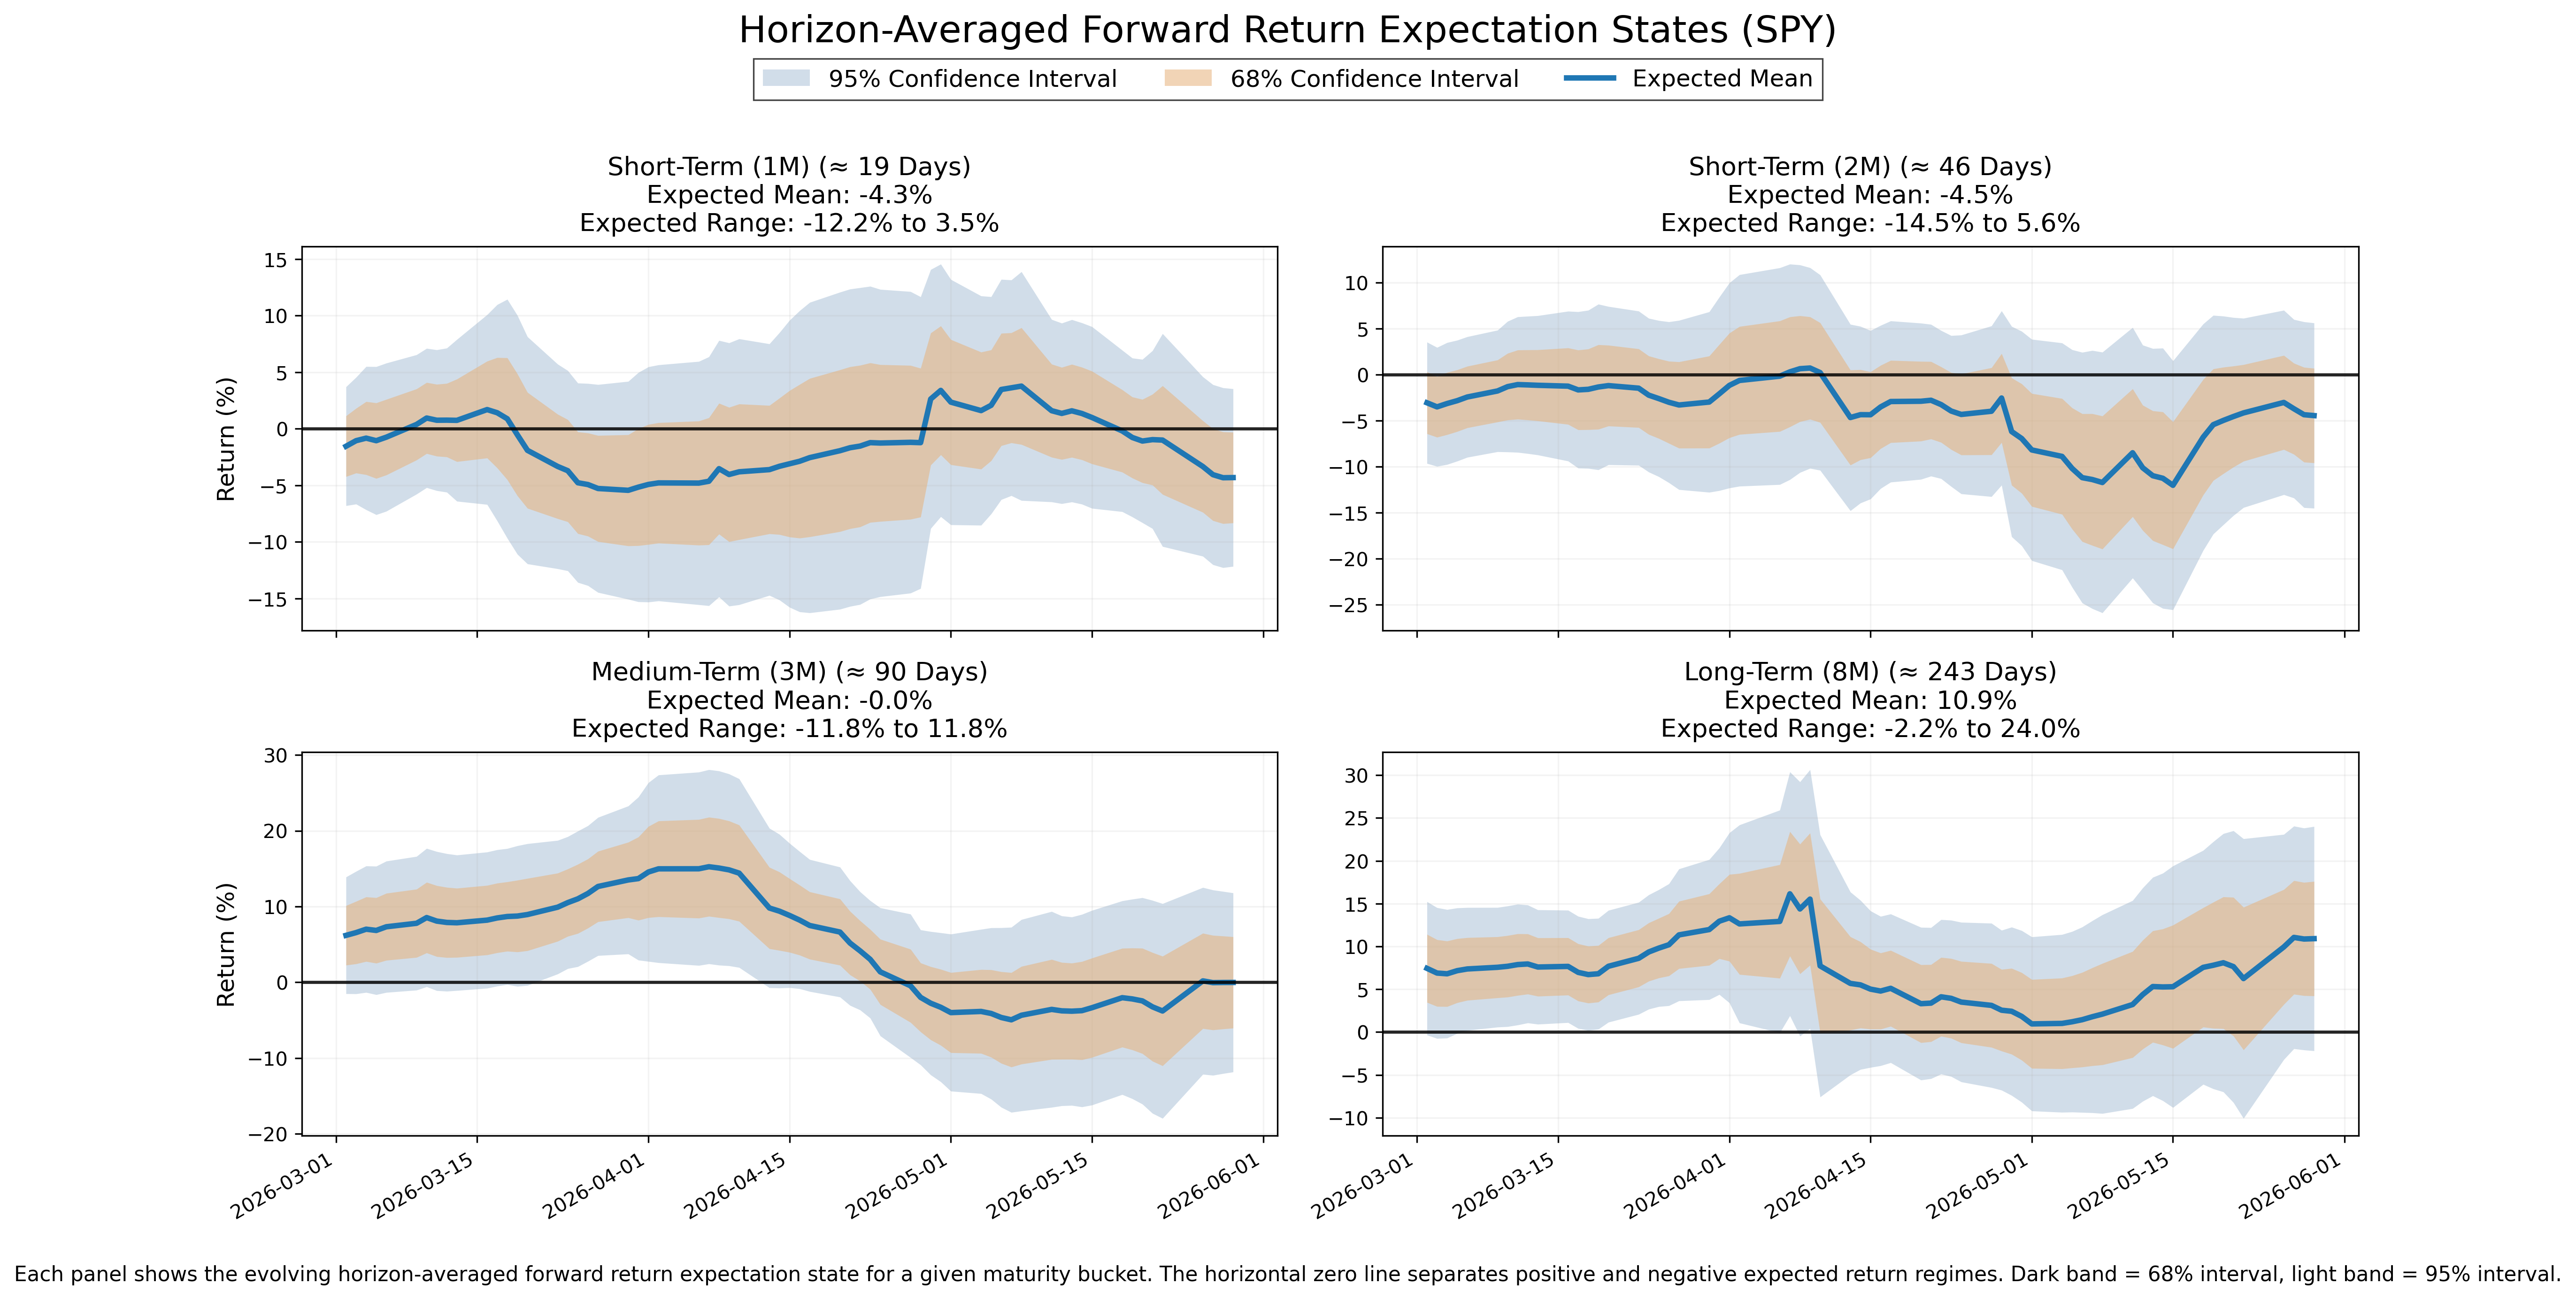
• Interpretation: Near-term structure is weakening, with defensive behavior becoming more visible even though the current uncertainty band is relatively narrow.
Short-Term (~1–2 months)
• State: Mixed
• Uncertainty: Moderate
• Interpretation: Short-term structure remains negative but is recovering, creating partial improvement while continuation quality remains unstable.
Medium-Term (~2–4 months)
• State: Mixed
• Uncertainty: Moderate
• Interpretation: Medium-term structure is neutral but improving, showing firmer behavior without enough current alignment to confirm a clean directional regime.
Long-Term (~6–12 months)
• State: Mixed
• Uncertainty: Wide
• Interpretation: Long-term structure is strengthening and remains constructive, but wide uncertainty keeps the longer-horizon signal broad and not fully confirmed.
The following chart shows the evolution of horizon-averaged forward expectation states. Each panel represents a maturity window, with the central line showing the average expected return structure across that horizon bucket and shaded regions showing uncertainty.
Options Market Structure
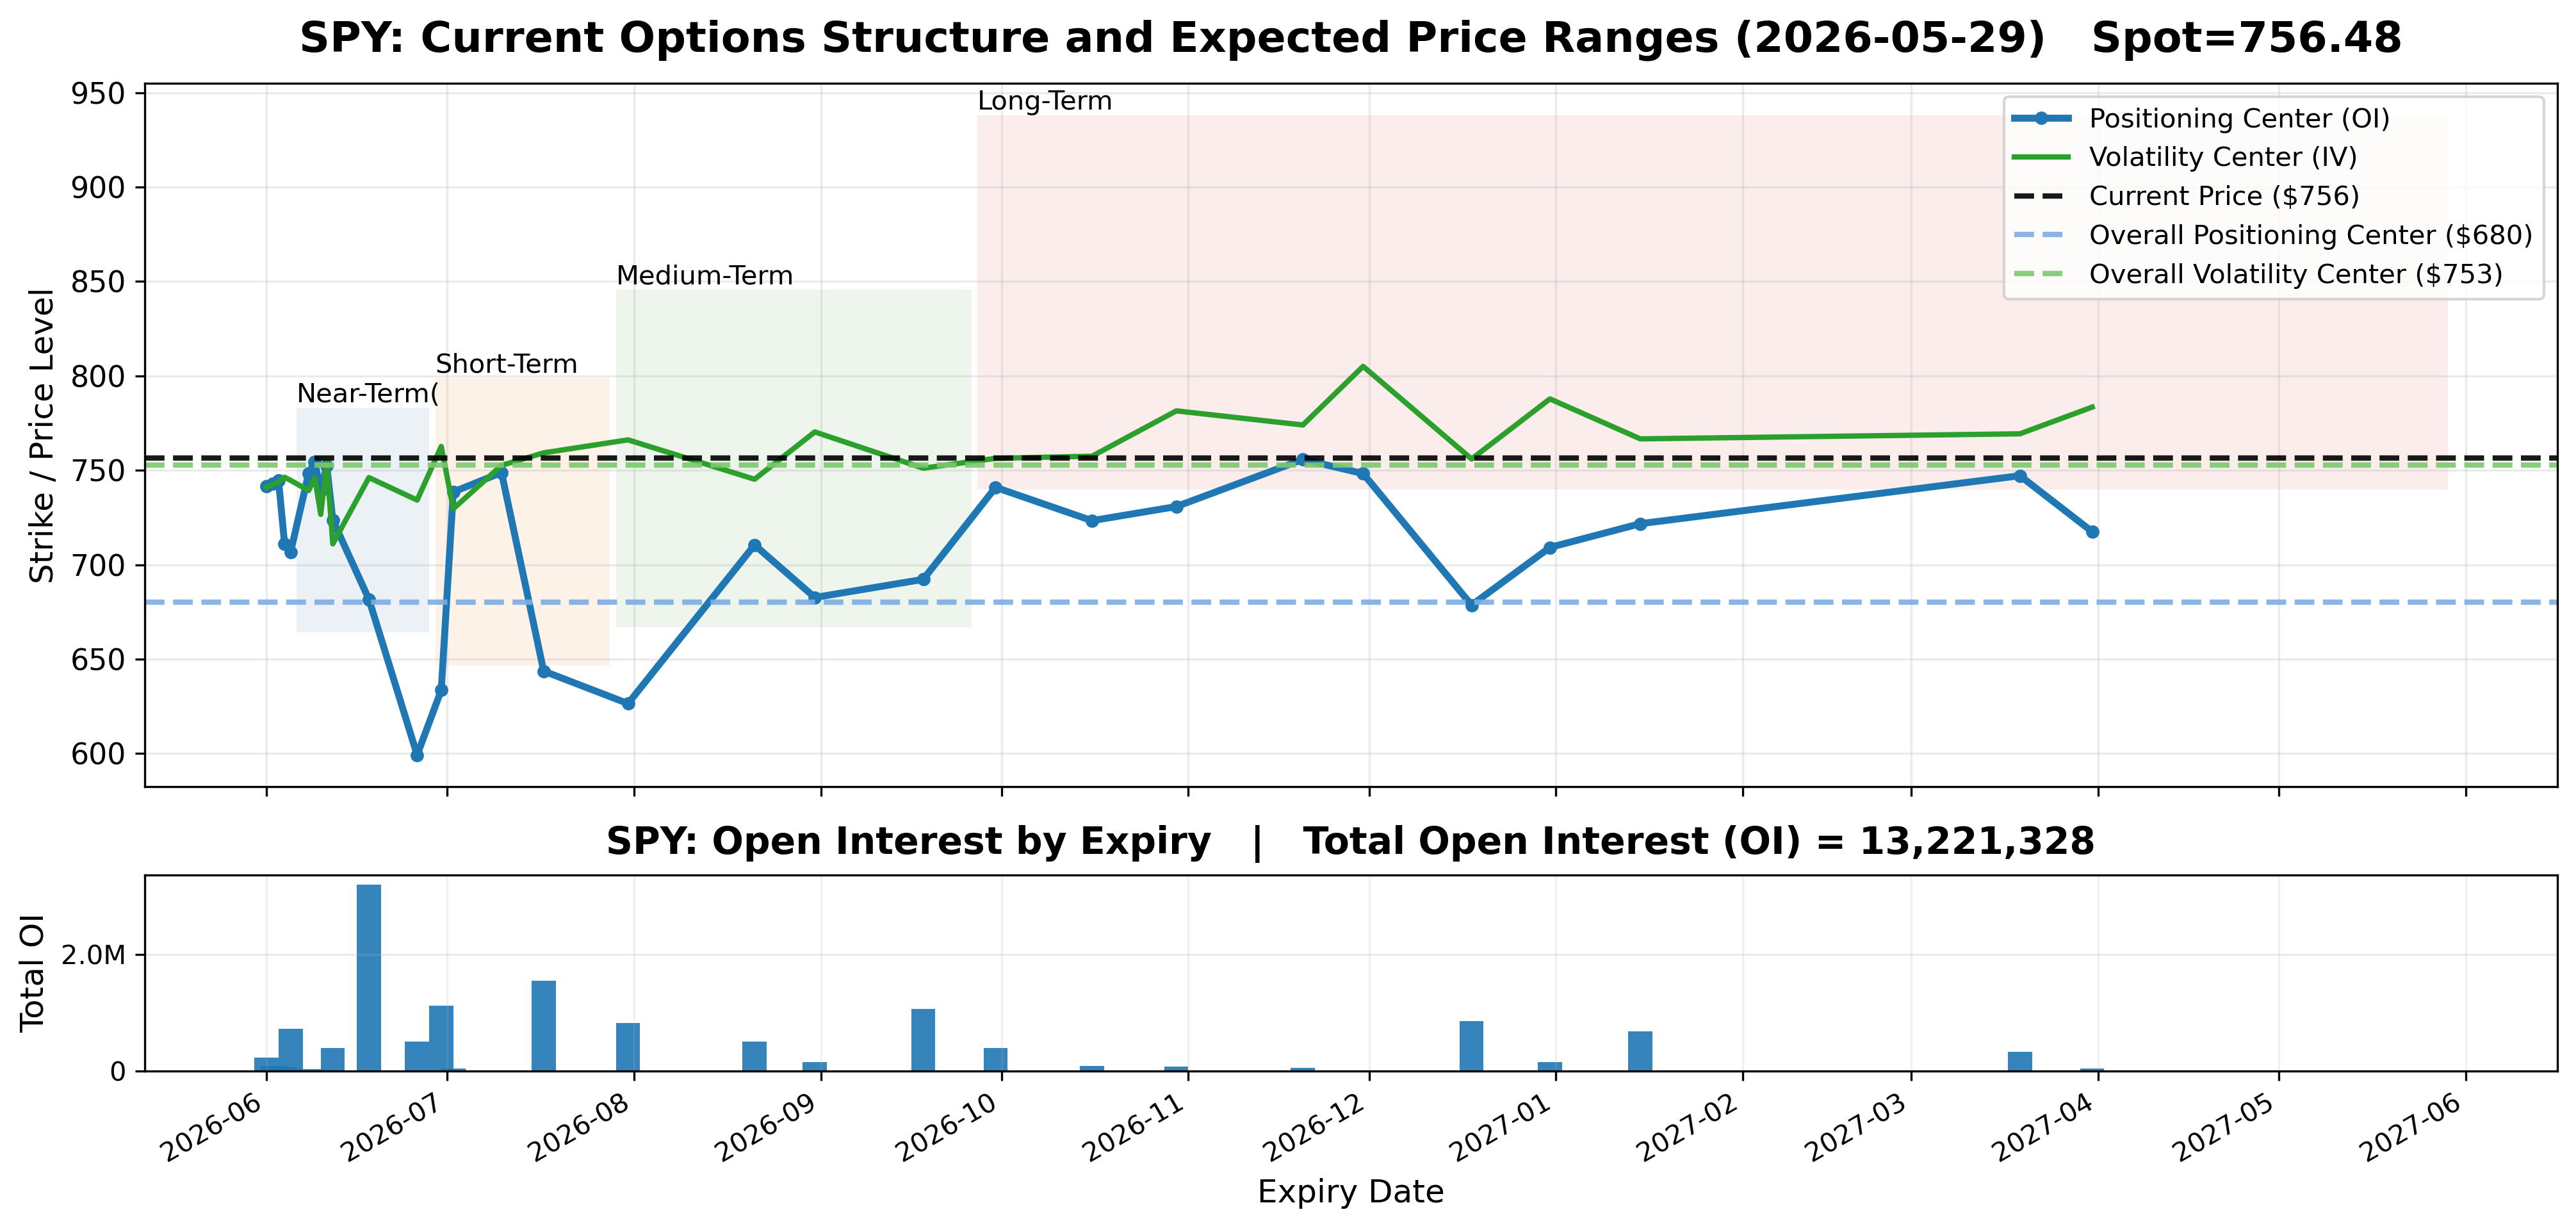
The options surface is concentrated most heavily in the June 18, 2026 expiry, which carries the largest listed open-interest share at the 19-day maturity. Additional near-term layers appear in the June 5, June 26, and June 30 expiries, creating a dense short-dated structure across the first month.
The July 17 expiry forms the largest secondary layer, with July 31 adding another intermediate maturity. Further layers appear in August, September, December, and January, showing that open interest is distributed across near, medium, and longer expiries rather than concentrated only at the front of the surface.
Spot is close to the overall volatility center, while the overall positioning center sits materially below spot. This describes a separation between the surface’s volatility center and aggregate positioning center without implying directional pull, support, or resistance.
The listed structure is layered. The largest concentration sits in the June monthly expiry, with meaningful secondary concentrations across July, September, December, and January.
The following chart shows today’s options market structure across expiration dates. Each point represents a future expiry, with positioning (open interest) and volatility (implied volatility) centers derived from current options data. Shaded regions show the expected price ranges for each horizon based on current market conditions. This is a cross-sectional view at a single point in time, not a time-series.
Bottom Line
SPY remains in an expanding volatility regime with weakening near-term behavior, recovering short-term structure, improving medium-term structure, and a strengthening long-term anchor. The market remains conflicted across horizons rather than currently aligned.
The structure is conditionally developing toward positive alignment across the short-, medium-, and long-term horizons. That alignment is not current. Near-term behavior is moving against the broader improvement and keeping the transition conflicted at the execution horizon.
Price behavior in this environment is generated through uneven repricing rather than smooth continuation. Movement is associated with partial follow-through, reversals, and unstable continuation because variability and horizon disagreement remain central to the current structure.
Decision conditions are sensitive to timing, persistence, and alignment reliability. Stable directional strategies remain disadvantaged while current alignment is conflicted. Structures that tolerate variability and fragmented movement are better matched to the measured environment.
Plain English: SPY is improving underneath, but the short-term tape is still fighting it. The broader structure is becoming more constructive, but near-term weakness and expanding volatility keep the market choppy, conflicted, and sensitive to timing.
Model Calibration Assessment
This report is generated from the output of a proprietary quantitative system that measures current options market structure, conditions, and forward expectations. This section evaluates the correctness and calibration of the underlying model.
The model remains calibrated.
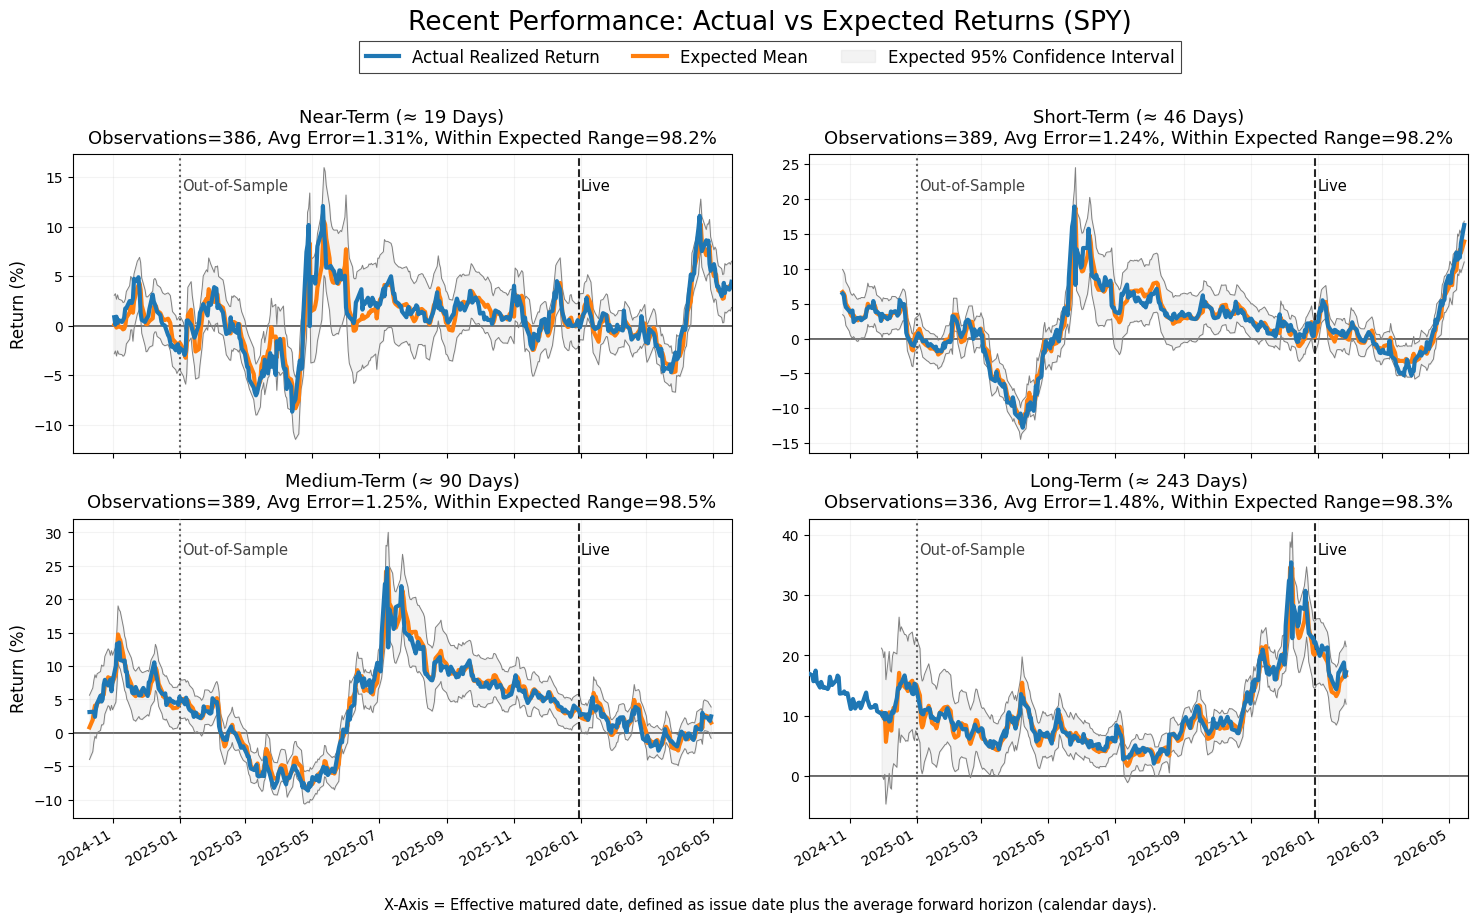
Across all four horizon buckets, realized returns continue to track the expected return structure closely, and realized outcomes remain inside the model's 95% confidence intervals at rates ranging from approximately 98.2% to 98.5%. Average forecast error remains low and consistent across horizons, with no meaningful deterioration in predictive quality visible in the live period.
Error behavior appears stable. The relationship between realized and expected returns remains intact across both trend and correction phases, and there is no visible evidence of systematic overestimation or underestimation developing through time. Deviations occur, but they remain bounded and are absorbed without producing persistent drift between realized outcomes and the expected path.
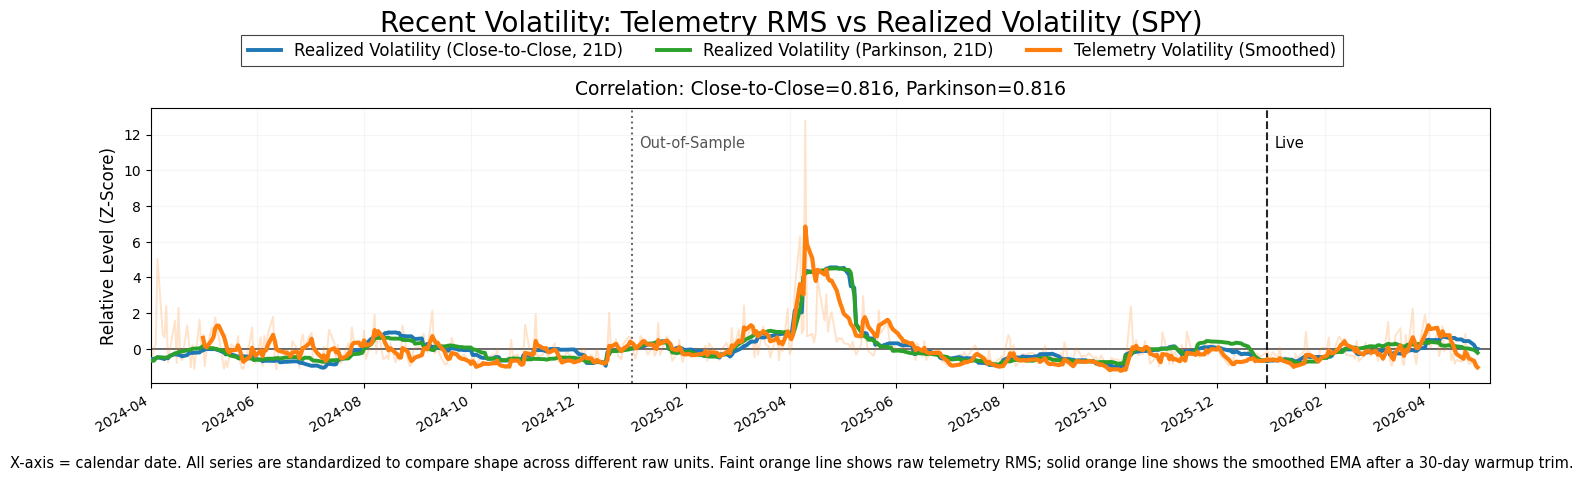
The volatility signal also remains calibrated. The innovation measure continues to move with realized volatility, maintaining a strong positive relationship across both close-to-close and Parkinson volatility estimates. Recent innovation levels remain modest relative to prior stress periods, indicating that realized market behavior remains broadly aligned with prior expectation structure despite the current increase in short-term repricing activity.
Overall, the validation charts show a model that remains stable, well-calibrated, and internally consistent, with no visible evidence of structural degradation in either the expectation framework or the volatility signal.
If you find this useful, you can support the work here. I’d also really appreciate hearing how you’re using this market data: any feedback helps me make this more useful in real workflows.