SPY Financial Telemetry Report
Week Ending 2026-07-24
Published 2026-07-26
Market-State Telemetry from Options-Derived Expectations and Innovation Dispersion
The Vyreon Financial Telemetry Report summarizes current conditions using a multi-horizon expectation framework, innovation-based volatility diagnostics, and options-market structure. The objective is not to predict exact future prices, but to quantify how expectations, uncertainty, volatility, and structural positioning are evolving through time.
Executive Synthesis
Raw innovation dispersion has moved above its rising smoothed trend, placing volatility in an expanding state and reducing near-term orderliness. Near-term expectations remain Mixed around a negative central tendency, short-term structure is recovering while medium-term structure remains unresolved, and the long-term horizon is Positive and strengthening. Current horizon consistency is fragmented and conditional confirmation is unclear, making reliability dependent on maturity rather than a single unified state.
State Classification
- Regime: Expanding volatility
- Near-Term (~2-4 weeks): Mixed, negative, stable or unclear
- Short-Term (~1-2 months): Mixed, recovering negative
- Medium-Term (~2-4 months): Mixed, stable or unclear
- Long-Term (~6-12 months): Positive, strengthening
- Structure: Fragmented, confirmation unclear
Market State
- Raw RMS is above the smoothed RMS while the EMA is rising, indicating expanding variability, but the measurement does not identify price direction.
- The near-term central expectation is negative while its interval crosses zero, producing a Mixed state with moderate uncertainty and leaving directional resolution limited.
- The short- and medium-term states are both Mixed; the short horizon remains negative but is recovering under tight uncertainty, while the medium horizon is positive but stable or unclear under wide uncertainty, leaving intermediate structure without uniform conviction.
- The long-term state is Positive and strengthening with moderate uncertainty, establishing the clearest directional anchor while retaining meaningful path dispersion.
- Current horizon relationships are fragmented, and conditional confirmation remains unclear because the medium-term tendency is unresolved, limiting confidence that changes are shared across maturities.
Market Insights
- Rising smoothed variability and raw error above trend imply less orderly movement, making entry timing more sensitive because repricing can occur faster than the underlying expectation structure can absorb and stabilize.
- The near-term central tendency remains negative without meaningful directional evolution, so short-horizon signals may persist only unevenly and remain vulnerable to reversal because the uncertainty band still spans both positive and negative outcomes.
- Tighter short-term uncertainty improves local path definition, but the medium-term band remains wide, reducing holding-period consistency because behavior that appears coherent in the shorter structural window may not remain reliable across the broader intermediate horizon.
- Disagreement across maturities and incomplete confirmation make signal quality maturity-dependent, increasing decision sensitivity to the selected horizon because positive evolution in short and long windows is not yet supported by a clear medium-term tendency.
What Changed This Week
- Near-Term (~2-4 weeks): Central expected return increased by 1.47 percentage points; the 95% interval width narrowed by 2.37 percentage points.
- Short-Term (~1-2 months): Central expected return increased by 1.73 percentage points; the 95% interval width narrowed by 6.98 percentage points.
- Medium-Term (~2-4 months): Central expected return increased by 0.58 percentage points; the 95% interval width widened by 2.80 percentage points.
- Long-Term (~6-12 months): Central expected return increased by 4.39 percentage points; the 95% interval width narrowed by 0.17 percentage points.
Volatility Regime
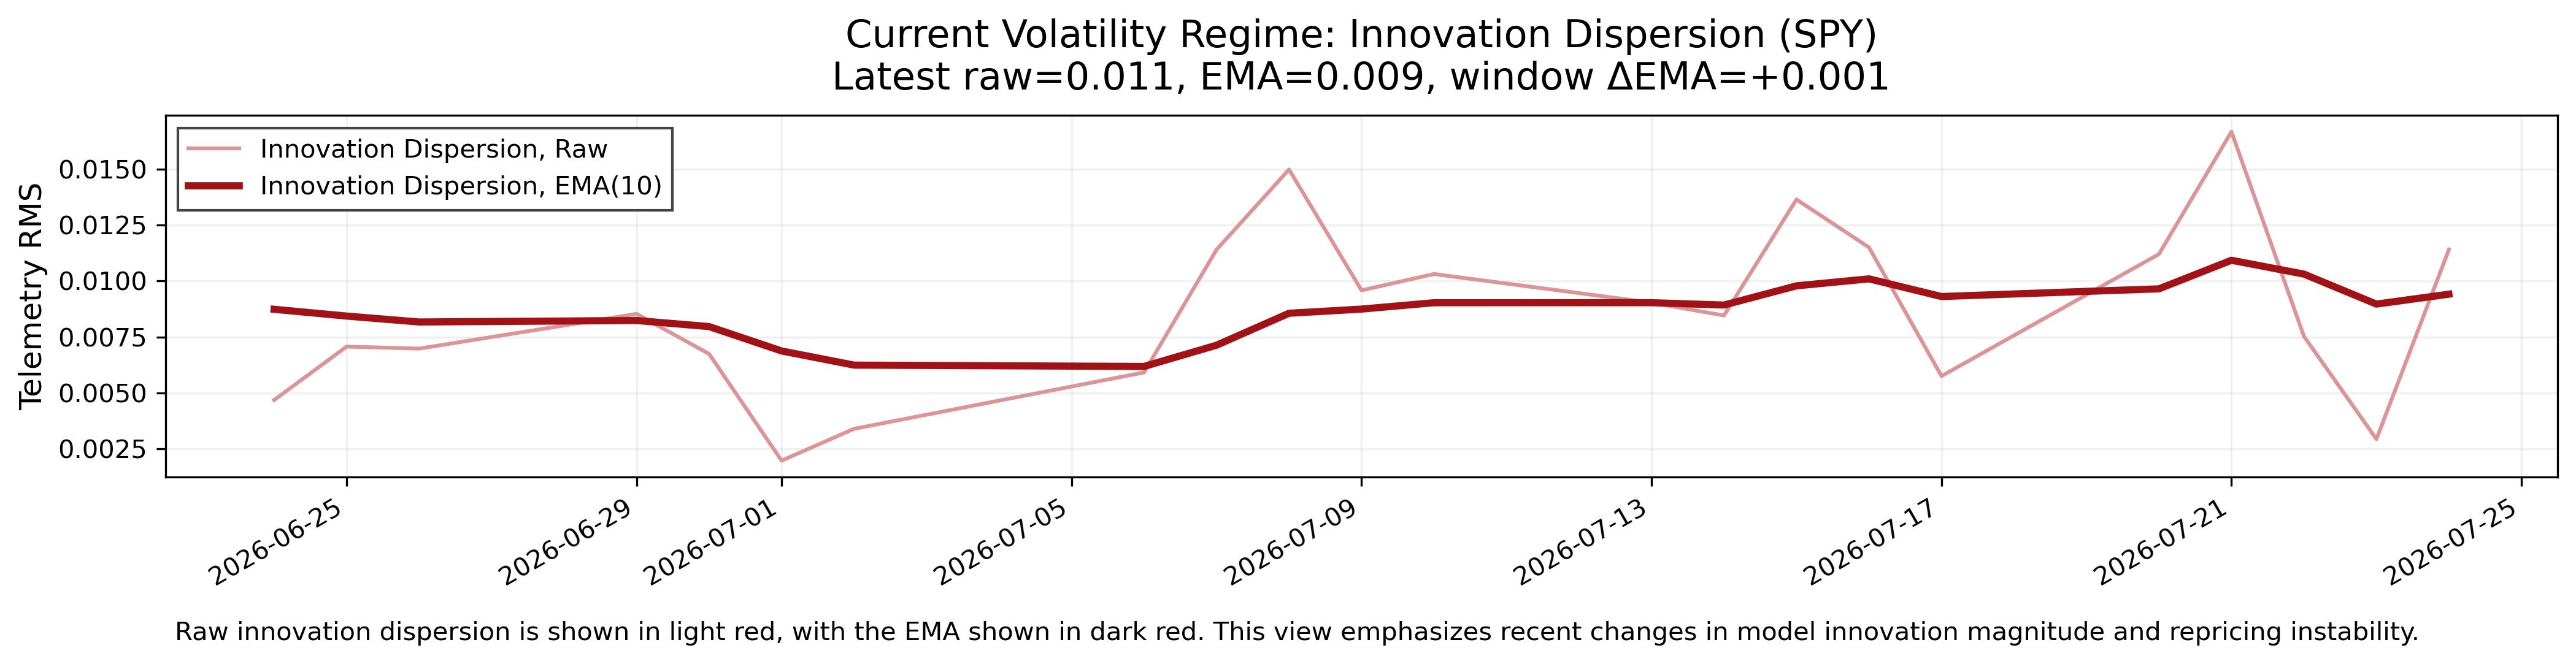
Raw RMS is above its smoothed RMS, and the EMA is rising. Current dispersion therefore sits above an increasing baseline, indicating reduced stability.
Less orderly movement can shorten persistence and accelerate repricing, forcing expectations to adjust more frequently as variability departs from trend. Volatility does not determine price direction.
The following chart shows recent market volatility using the RMS of model error. The light line shows raw model error, while the darker line shows the smoothed trend. This view highlights short-term changes in variability and how current movement compares to its underlying trend.
Horizon-Averaged Forward Expectations
Near-Term (~2-4 weeks)
- State: Mixed
- Uncertainty: Moderate
- Interpretation: The negative central tendency is stable or unclear rather than evolving, while moderate uncertainty and an interval spanning both signs limit directional reliability.
Short-Term (~1-2 months)
- State: Mixed
- Uncertainty: Tight
- Interpretation: The negative central tendency is recovering through weak positive evolution, while tight uncertainty gives this horizon the most contained path estimate despite incomplete directional repair.
Medium-Term (~2-4 months)
- State: Mixed
- Uncertainty: Wide
- Interpretation: The positive central tendency is flat and stable or unclear, while wide uncertainty makes the path diffuse and reduces confidence in the durability of that reading.
Long-Term (~6-12 months)
- State: Positive
- Uncertainty: Moderate
- Interpretation: The positive central tendency is strengthening through strong positive evolution, while moderate uncertainty preserves the clearest directional anchor without making the path precise.
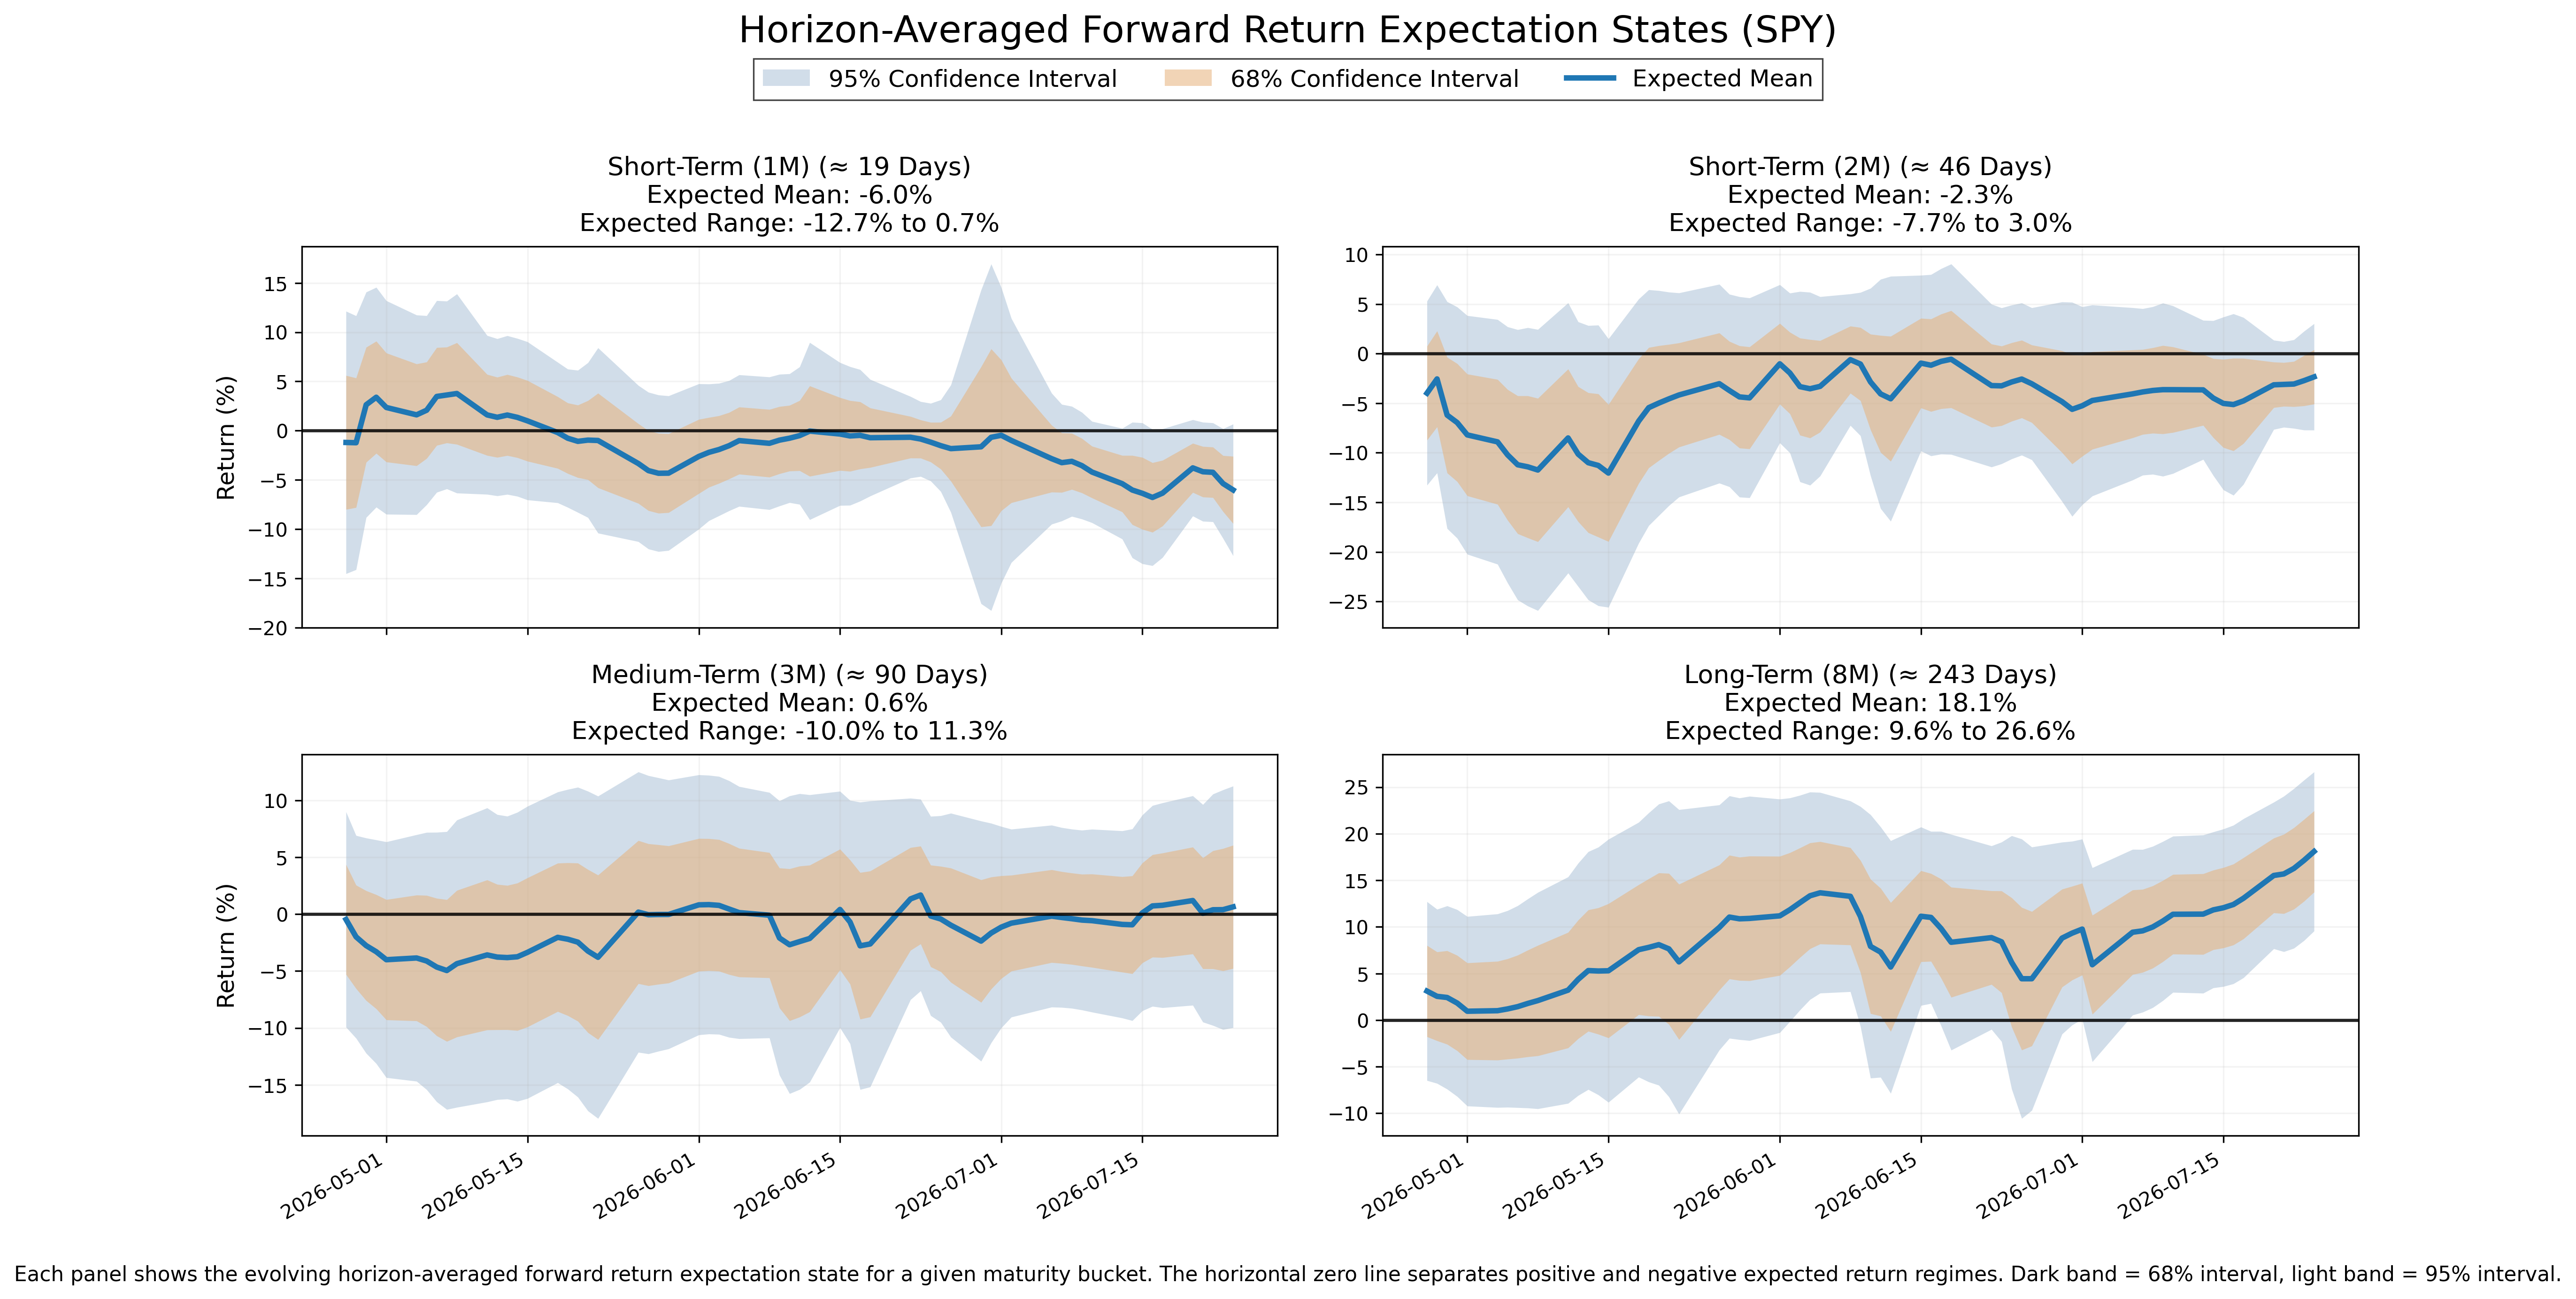
The following chart shows the evolution of horizon-averaged forward expectation states. Each panel represents a maturity window, with the central line showing the average expected return structure across that horizon bucket and shaded regions showing uncertainty.
Options Market Structure
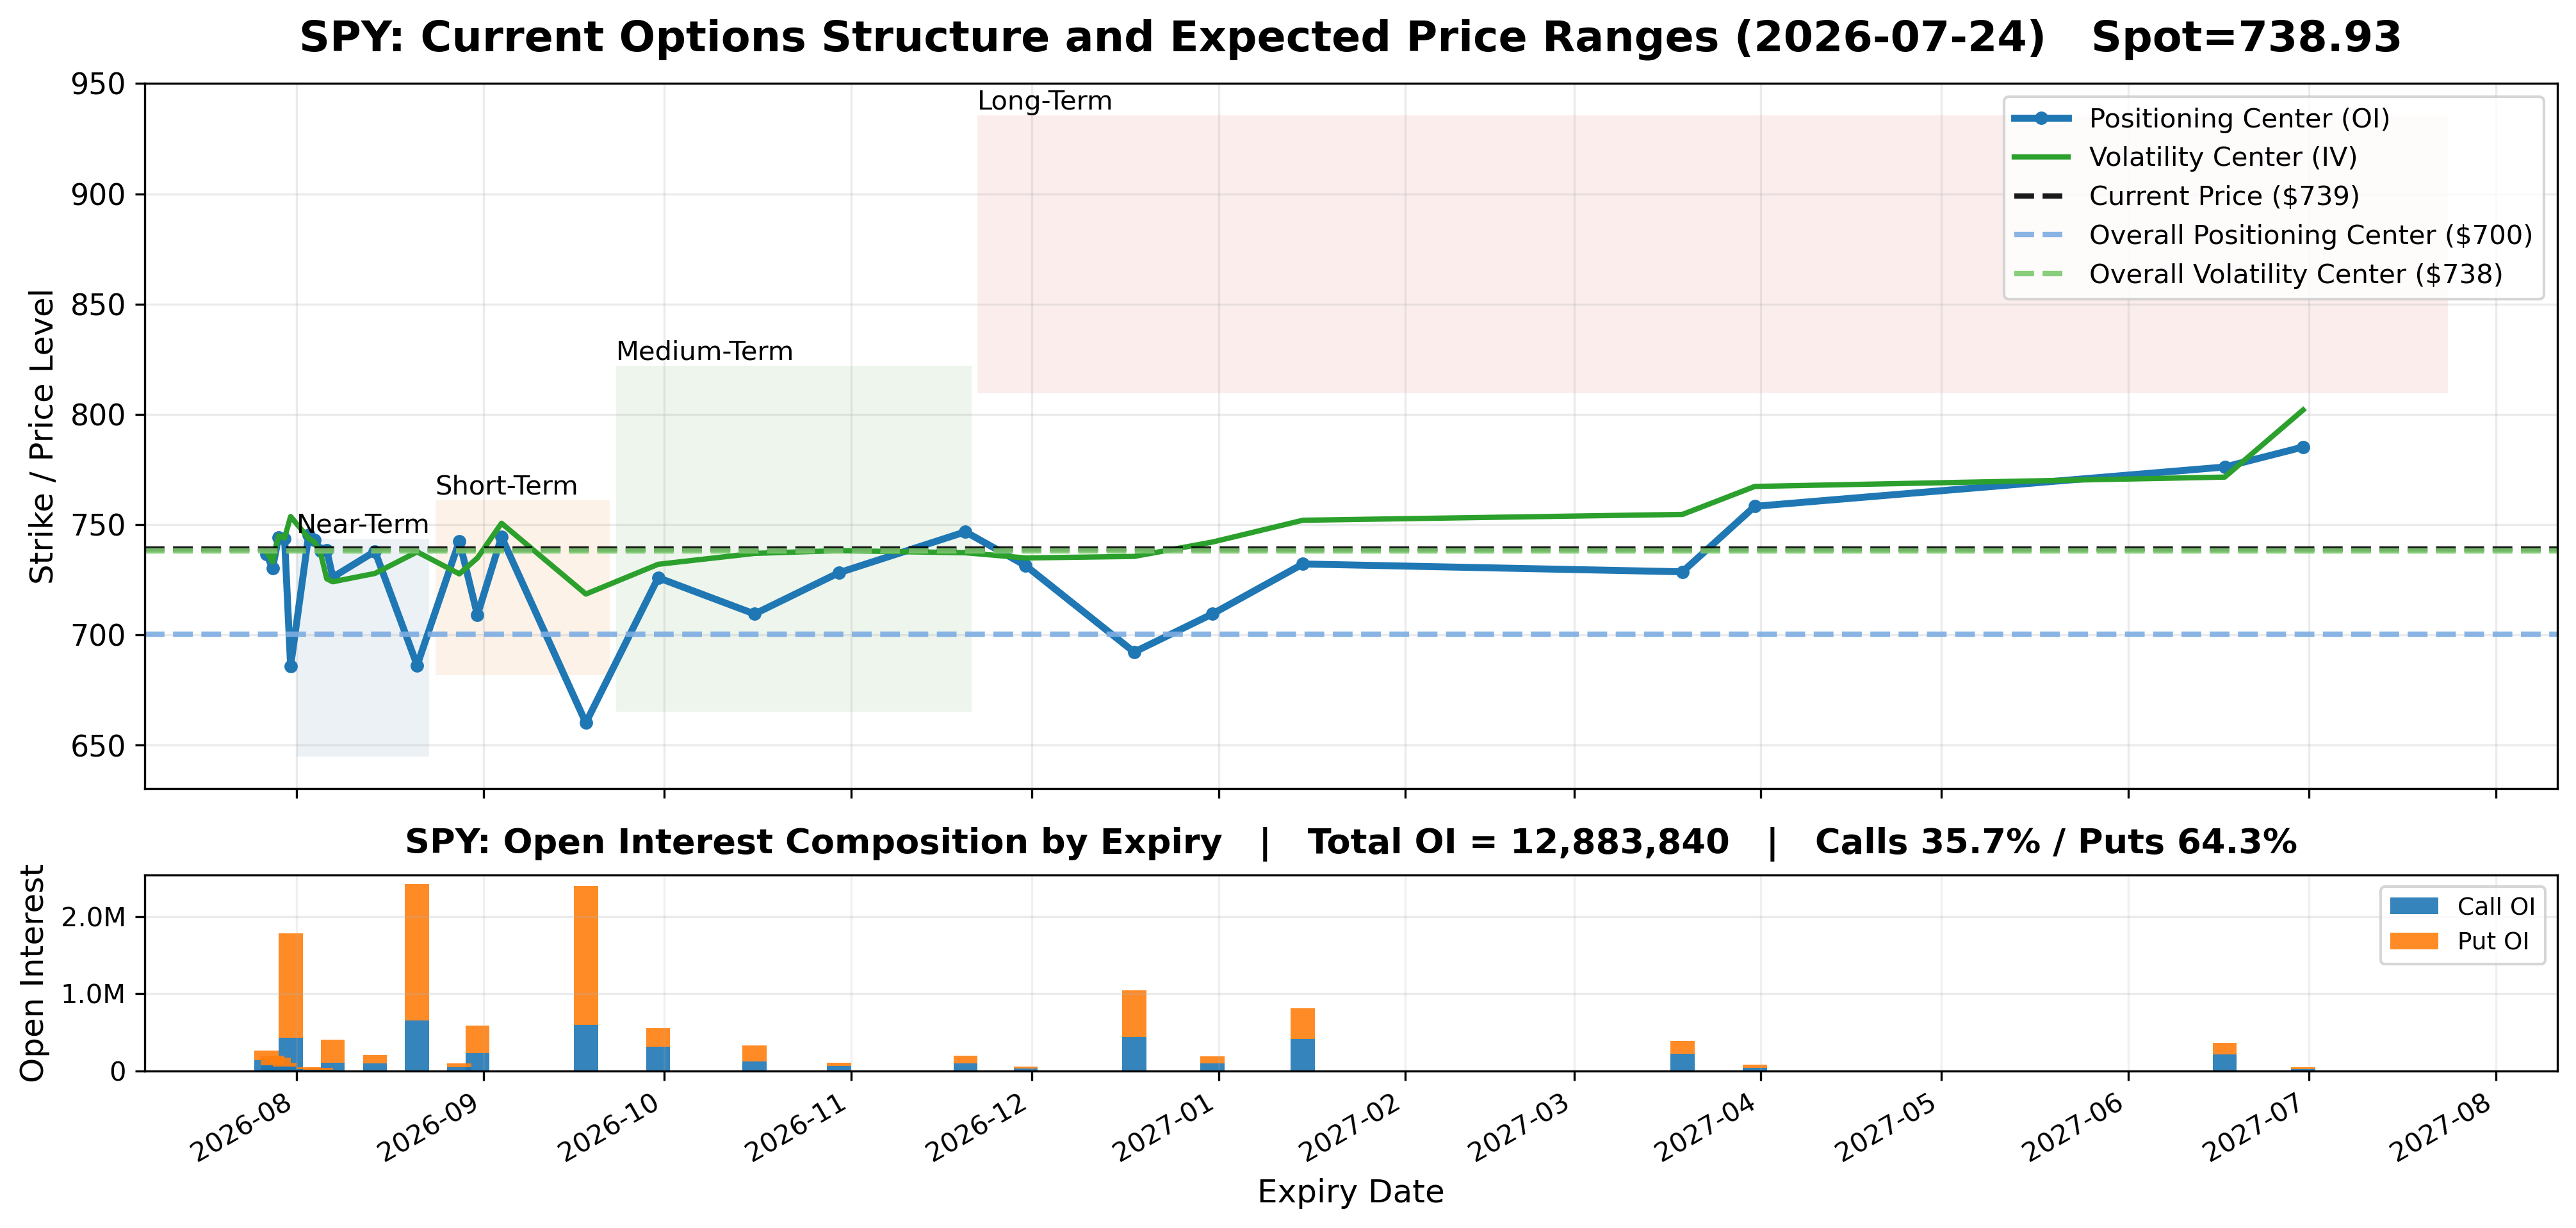
Open interest is concentrated in the August 21 and September 18 expiries at 18.8% and 18.6% of classified inventory, with July 31 adding 13.9%. Smaller December, January, March, and June layers extend exposure across maturities, so the structure remains expiry-dependent rather than evenly distributed.
Classified open interest is 35.8% calls and 64.3% puts, and the largest near-dated expiries are more put-heavy while selected later expiries become balanced or call-heavy. This is a composition contrast in current contract inventory, not evidence of trader intent or price direction.
Spot at 738.93 is above the 700.29 positioning center and nearly aligned with the 738.04 volatility center. These cross-sectional relationships do not imply support, resistance, pinning, attraction, dealer positioning sign, or future direction.
The following chart shows today's options market structure across expiration dates. The upper panel compares positioning and implied-volatility centers with the current horizon ranges. The lower panel shows total open interest by expiry, split into call and put contracts; total bar height remains total open interest. This is a cross-sectional view at a single point in time, not a time series.
Bottom Line
The operating environment combines expanding variability with a negative near-term bias, recovering short-term structure, an unresolved medium-term layer, and a strengthening positive long-term anchor.
Central expectations improved across every horizon this week, with the largest increase at the long horizon; uncertainty narrowed near and short term, widened medium term, and was nearly unchanged long term. Because medium-term direction remains unclear, these improvements have not produced broad confirmation.
Raw dispersion above a rising smoothed trend implies less smooth movement, weaker short-horizon persistence, and greater reversal and repricing sensitivity, while the longer positive structure remains more stable than the execution layer.
Timing sensitivity is highest at shorter maturities, holding-period consistency weakens across the unresolved intermediate layer, and signal reliability improves toward the long horizon. The dominant risk is treating maturity-specific evidence as a single coherent market state.
In plain language, the market structure is improving at several horizons but remains uneven: near-term behavior is still negative, the middle is not fully resolved, long-term expectations are strengthening, and variability is expanding.
This report is generated from the output of a proprietary quantitative system that measures current options market structure, conditions, and forward expectations. This section evaluates the correctness and calibration of the underlying model.
Model Calibration Assessment
Calibration status: Maintained.
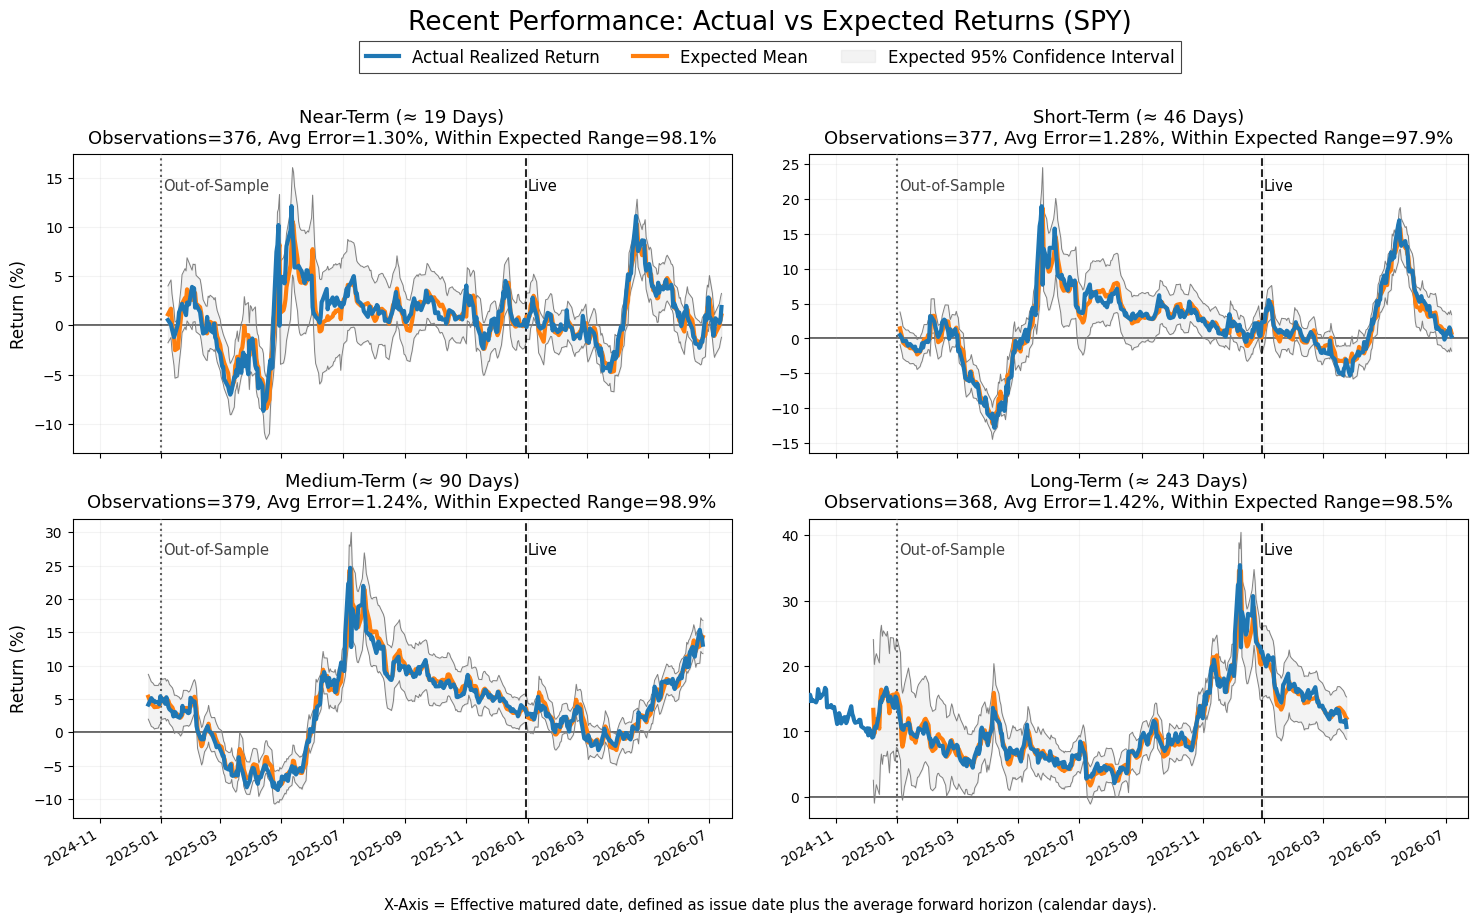
Realized returns remain within the expected 95% confidence intervals approximately 97.9% to 98.9% of the time across all four horizons. Coverage remains consistently above the nominal threshold, indicating that uncertainty estimates continue to be well calibrated.
Average errors remain stable at approximately 1.24% to 1.42%, and actual versus expected returns continue to move together without visible systematic bias or persistent directional drift.
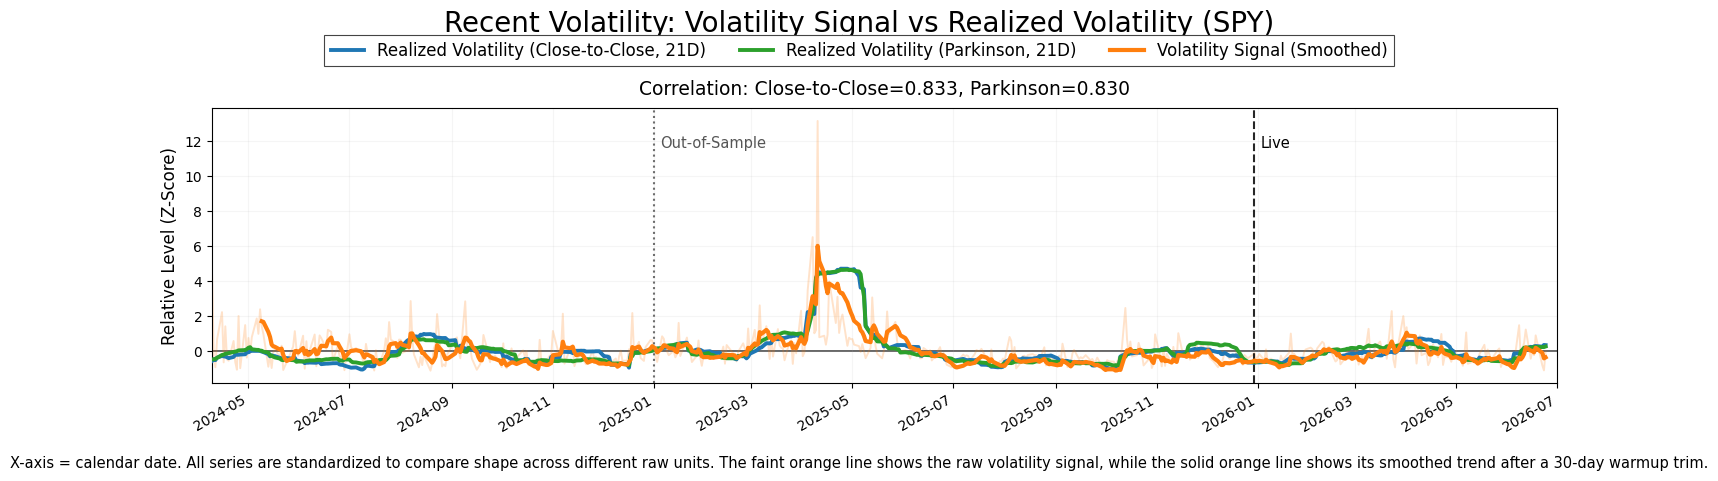
The volatility signal continues to reflect changes in model innovation magnitude and the alignment between realized market behavior and prior expectations. Following correction of a validation pipeline initialization artifact, correlation with realized volatility measures 0.833 (close-to-close) and 0.830 (Parkinson), remaining consistent with recent historical performance and continuing to capture broad changes in market variability.
Correction (2026-07-28): During routine validation, I identified an initialization artifact in the validation pipeline that caused the reported volatility correlation statistic to include the telemetry EMA warmup period while the plotted series excluded it. The underlying model outputs, forecasts, and market assessment were unaffected. This correction applies only to the reported validation statistic.
Overall, the model remains calibrated. Forecast calibration, interval reliability, and volatility tracking remain consistent with recent historical performance.
If you find this useful, you can support the work here. I’d also really appreciate hearing how you’re using this market data: any feedback helps me make this more useful in real workflows.
Trial API access to daily telemetry data is available upon request.